Introduction to Snowflake
Snowflake established itself as one of the most widely used cloud data platforms, providing a scalable and flexible architecture for building, maintaining, and operating Enterprise Data Warehouses. While it aims to eliminate data silos and simplify the data structure, with billions of queries a day (overall), its elastic computing handles the workload for good performance and a satisfied customer.
However, as organizations rely increasingly on Snowflake, monitoring their solution might be crucial for performance optimization, error and root cause analysis, and cost control. Although Snowflake handles these tasks very well on its own, experience shows some need for human interference when it comes to more complex queries, to increase performance, lowering the runtime without upscaling or scaling out.
This blog article aims to provide general information about and technical insights into Snowflake. Focusing on techniques as well as built-in tools to analyze bottlenecks, we aim to potentially increase performance and therefore decrease unnecessary costs.
In this article:
Snowflake Built-In Tools
Query History
Starting with Snowflake’s built-in tools, we will dive into its roots and combinations of several metrics.
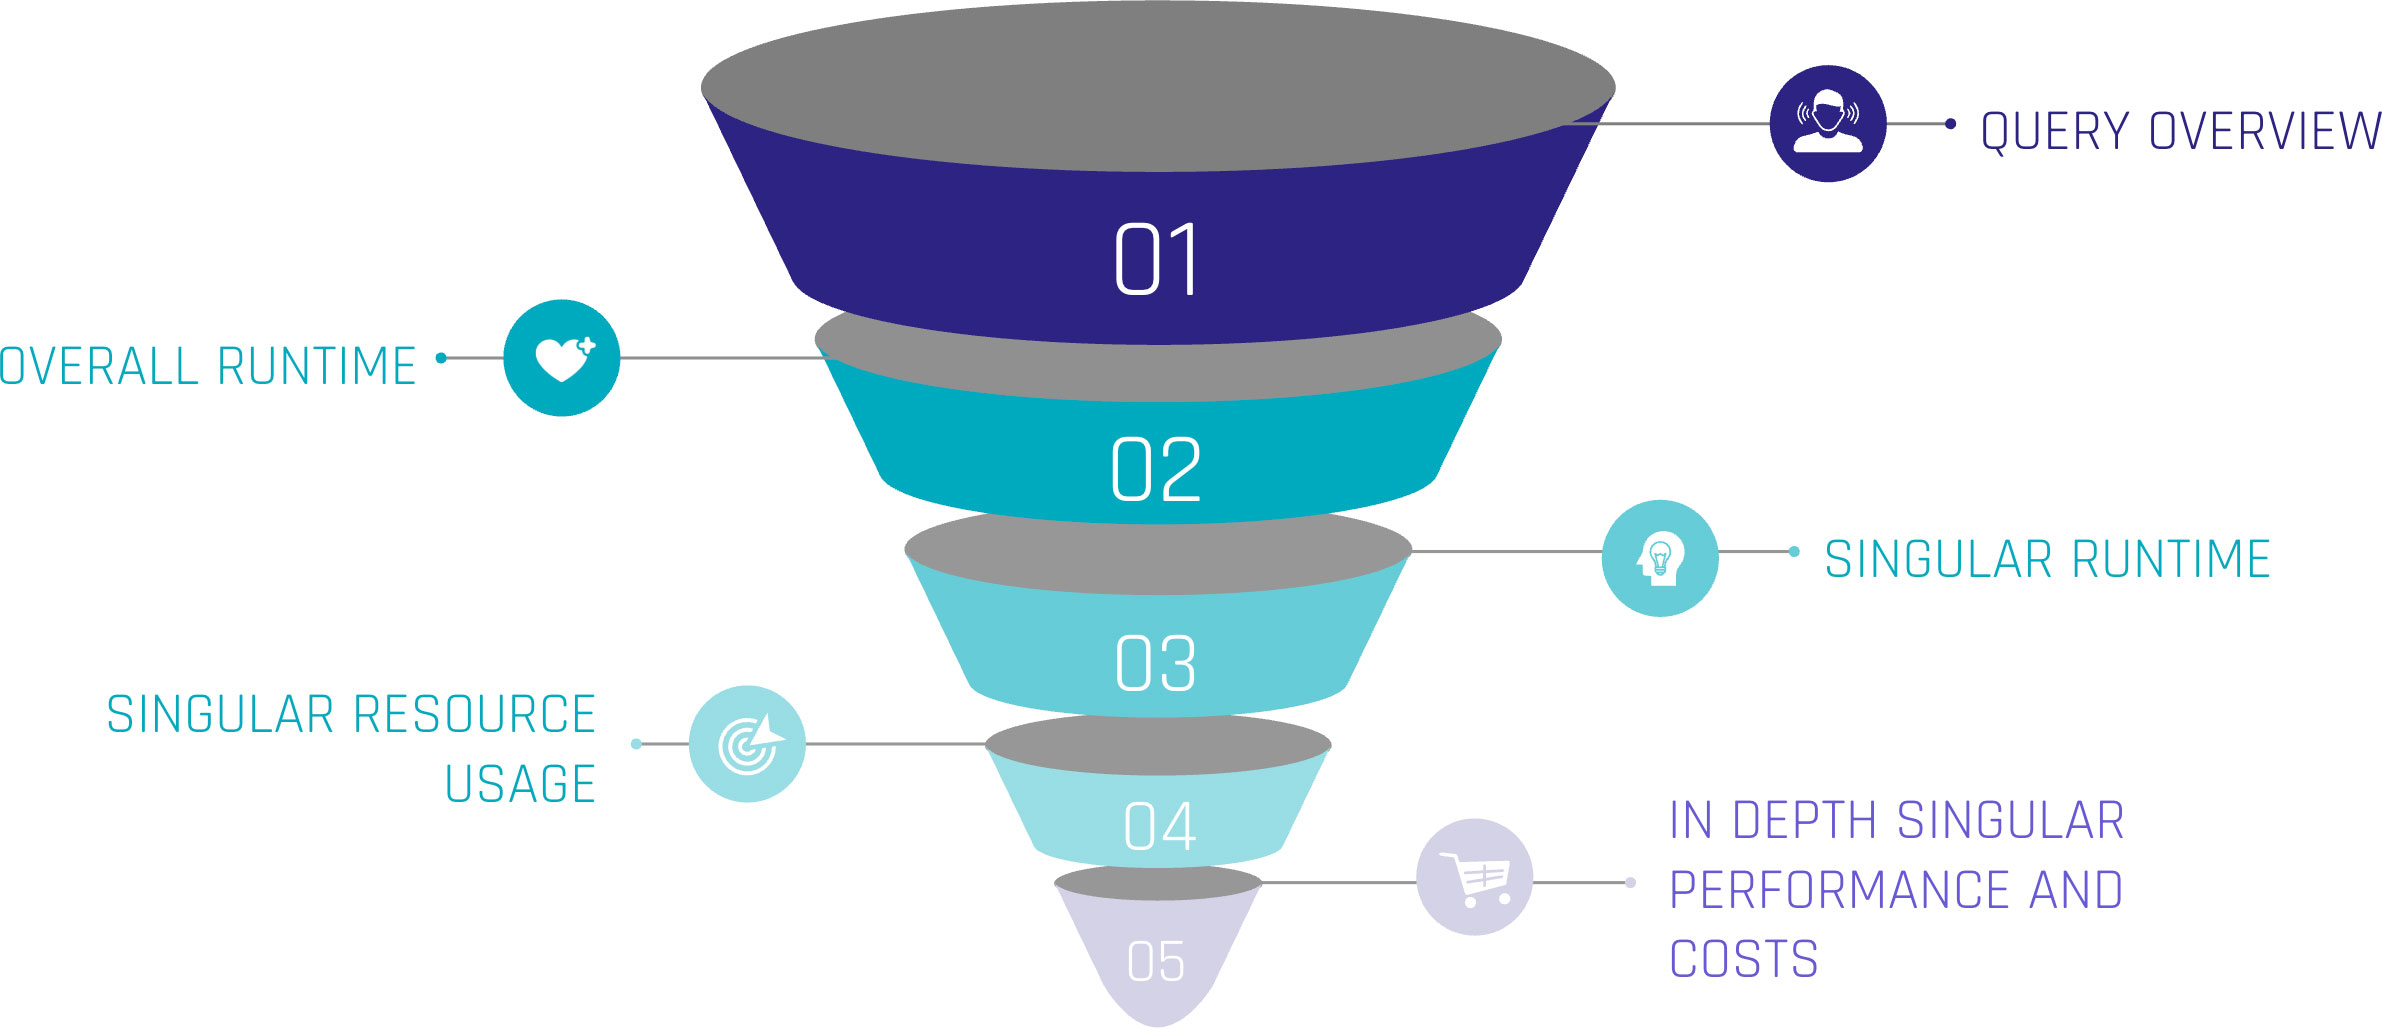
Monitoring query performance includes several depths of insight, from an overview of the general query history, down to the performance of each individual step within a query.

Let’s assume the top level as an overview of our queries. Including metrics such as:
- Start Time,
- Total Time,
- Status and
- Query Type.
For the first level, we can gain insights when the queries start, how much time they were consuming, whether they succeeded or failed, or even are still running. Lastly, we can see the type of query, such as ‘CREATE TABLE’, ‘INSERT’, or ‘SELECT’. At this level, a brief overview could be created about the traffic within the Warehouse.
When hearing about this, you may be familiar with a built-in tool called ‘Query History’, which tracks this kind of information automatically without the need for user interference. It is easily available within the sections ‘Monitoring’ and ‘Query History’.
Query Profile
Further, it is easily possible to extract more information about the executed queries. Every single query within the ‘Query History’ has a unique identifier and attached metrics. Within the ‘Query History’ section, when choosing a query by simply clicking on it, we gain insights into the single query. These include two main sections.
‘Query Details’ delivers information about the query in general. Including the above-mentioned ‘Start Time’, ‘End Time’, ‘Warehouse Size’, and ‘Duration’, which is divided into ‘Compilation’, ‘Execution’, and further time-consuming steps.
‘Query Profile’ describes the execution plan of the query as a graphical representation. Each step within the query, such as ‘SELECT’, ‘JOIN’, and ‘WHERE CONDITION’ are represented as nodes within the graph. These nodes are operations, triggered by the query. Each fulfilling a task like filtering data, selecting data rows, but also scanning results, and reading data from cache. Snowflake interprets the written SQL and creates a performant execution plan by itself.
Despite that, each node consumes more or less resources, depending on the SQL code itself, the underlying dataset, and the Warehouse configurations. Using the ‘Query Profile’, we can identify the most time-consuming steps in our query, such as false ‘JOINS’, and work around those nodes to identify more performant solutions. Therefore, the ‘Query Profile’ provides detailed information about each node, like processing time, cache scanning, and partition pruning. For further information, check out the Snowflake Documentation.
Custom Monitoring Solution
But when Snowflake already provides a solution, why do we need separate monitoring?
Although already delivered, your requirements may vary from the existing solution. With the built-in tools mentioned above, the possibility to check on each query is given. Additionally, Snowflake may not be the only tool used for data processing. ELT tools like dbt or Coalesce help data engineers improve processes. To include these further metrics from outside Snowflake, a custom monitoring solution, based on Snowflake’s delivered metrics, is needed.
With this in mind, the following section focuses on our own scalable monitoring solution.
Account Usage and Information Schema
With the idea that the data of the graphical output exists as a table or view, containing all data necessary, it turns out that Snowflake provides us the schemas ‘ACCOUNT_USAGE’ and ‘INFORMATION_SCHEMA’, fulfilling this purpose. They provide similar opportunities for this challenge, although there are some differences.
‘ACCOUNT_USAGE’ provides insights into Snowflake metadata of several objects. This includes ‘QUERY_HISTORY’, which contains the information described in the sections above. The query history is available for all queries within the last 365 days. This enables the loading of metrics entities in the Data Warehouse, making the information readily accessible and persistent for daily, weekly, or monthly processes. The downside is that access to the ‘ACCOUNT_USAGE’ schema is often limited.
The ‘INFORMATION_SCHEMA’ contains a set of system-defined views and tables, providing metadata and information about created objects. Using predefined functions on the ‘INFORMATION_SCHEMA’, metadata can be retrieved, which, on the other hand, is limited to some factors. As this option is more accessible for developers, the focus remains on this option.

Extract Metrics Data
At the beginning, it is crucial to point out the limitations and possibilities of this approach. For the scope of this blog, two functions on the ‘INFORMATION_SCHEMA’ are needed.
‘QUERY_HISTORY_BY_WAREHOUSE()’ is equal to ‘QUERY_HISTORY’.
‘GET_QUERY_OPERATOR_STATS()’ is the equivalent of ‘QUERY_PROFILE’.
‘QUERY_HISTORY_BY_WAREHOUSE()’ takes four different arguments.
- ‘WAREHOUSE_NAME’ – The name of the Warehouse executing the queries
- ‘END_TIME_RANGE_START’ – Time range within the last 7 days, in which the query started running
- ‘END_TIME_RANGE_END’ – Time range within the last 7 days, in which the query completed running
- ‘RESULT_LIMIT’ – The number of the maximum returned rows. The default lies by ‘100’, the range by ‘1’ to ‘10.000’
The output is the ‘QUERY_HISTORY’ as a structured table with some extra information. Each query is displayed in one row. Therefore, the metrics are aggregated into one specific query.
The most critical limitation seen here is the ‘RESULT_LIMIT’ and ‘END_TIME_RANGE_*’, as it forces us to retrieve the data before the 7-day retention ends and before 10.000 other queries have been executed. Depending on the size of the Warehouse and the scope of the monitoring range, the extract and load process must be customized.
‘GET_QUERY_OPERATOR_STATS()’ takes one argument.
- ‘QUERY_ID’ – The unique ID of the executed query.
The output is a structured table of the ‘QUERY_PROFILE’ of one specific query. Each step in the execution plan is displayed as one row, so the output size depends on the complexity of the query itself. Each node is detailed with available metadata, breaking down information from ‘GET_QUERY_OPERATOR_STATS()’ into individual steps. This allows for a deeper analysis of performance metrics, helping to identify any bottlenecks.
As the function is on query-level, it is not done by joining the table outputs of those two functions together to get a satisfactory result. Further steps are needed.

Load Metrics Data
Before filtering, transforming, or joining the data, it is suggested to load the data as it comes into persistent tables.
Snowflake Query History
The first step should be to create the table when calling the function, already combining these two components to avoid missing capture data, columns, or false data types. To keep continuous loading, use your preferred ELT tool to append the process at the end, or set up a scheduled Snowflake Task, considering the limitations mentioned above.
Snowflake Query Profile
This process is more complex. To load the data, it is not sufficient to simply call the function once for the query history. To ensure data integrity and a clear 1:n solution (1 row in the query history, n>0 rows in the query profile), it is needed to iterate through the list of all query IDs inside the query history and run the function for each one of them. Each of the resulting datasets needs to be inserted into the corresponding table.
Information Delivery
Now, as the data is extracted and loaded, the last remaining steps are transforming the data and information delivery. As this strongly depends on the use case, we focus on linking the two metrics tables and creating a standard dashboard inside Snowflake to show the results.
Our two tables ‘snowflake_query_history’ and ‘snowflake_query_profile’ are in a soft relation, where the “QUERY_ID” serves as a unique identifier to link each query from the query history to its query profile. Therefore, joining both tables on the “QUERY_ID” is indispensable. The first decision to be made is whether to keep one row for each query and aggregate the object constructs or to split it up into its individual steps, like within the query profile. For simplicity, we focus on the second option to avoid complex SQL statements for the dashboard. As the SQL statement only includes the ‘SELECT’ and ‘JOIN’ operators, you may choose a view as materialization, instead of a table.
With the possibility of creating dashboards out of Snowflake worksheets, it is relatively easy to integrate simple SQL statements into the dashboard, represented as charts. For some examples, we will take a look at the resulting data.

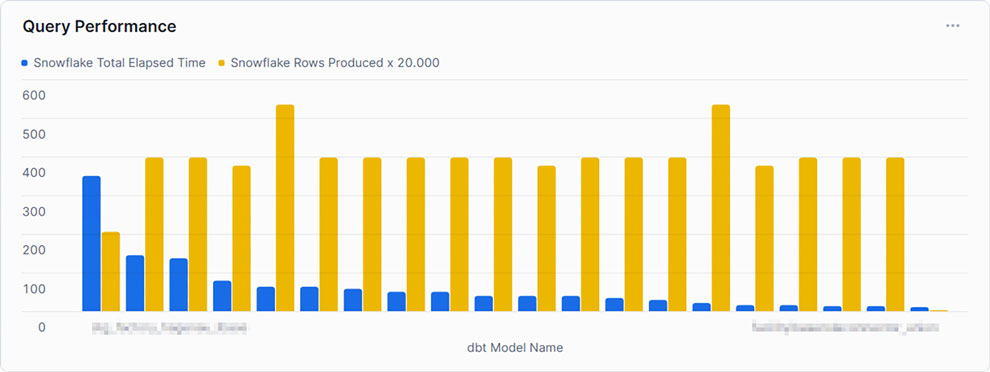
This example shows the top 20 queries by ‘TOTAL_ELAPSED_TIME’, the overall time the query needs to compile, run, waiting time, and other technical steps. As noticed by the chosen x-axis label, Snowflake’s metrics can be combined using other tools, such as dbt. It is set to compare this time against the produced rows to gain some insights into whether the queries can handle much data or not. As can be seen, the query consuming the most time, and therefore credits, does not produce the most rows. At this point, we may be interested in gaining some insights into the query itself.

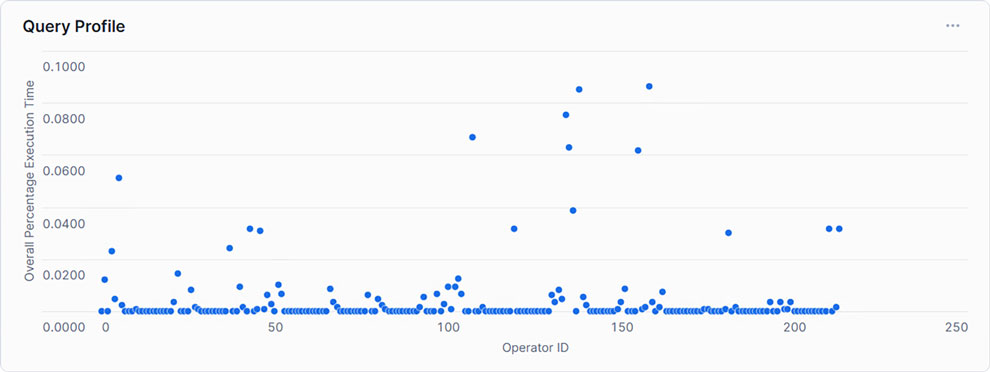
Showing each Operator with its corresponding relative runtime, only a handful exceed 5% of the total execution time. This may indicate that within the SQL statement, only a few steps need to be optimized to create an overall more performant query.

With this in mind, the single query can also be analyzed in the dashboard. For example, you may take into account input rows and output rows, bytes spilled, partitions scanned, and partitions total, or the join condition. Furthermore, you may not only gain insights into your query performance, but also into your table management, such as clustering and partitioning. Additionally, you are also capable of integrating more metrics coming from external sources and linking them directly to Snowflake, making it a powerful monitoring solution.
Conclusion
Snowflake offers a powerful and highly adaptable cloud data platform that meets the demands of modern enterprise data warehousing. However, as data volume and complexity grow, so does the need for proactive monitoring and optimization to ensure continued performance and cost efficiency. By leveraging Snowflake’s built-in tools and implementing strategic performance-enhancing techniques, organizations can address bottlenecks effectively and optimize query performance.
In this article, we addressed the opportunities given through Snowflake’s built-in tools and how to effectively use them. We learned that although these tools are great, to gain a fast and high-level overview, as well as detailed insights at the same time, it is relatively easy to create your own dashboard with the loaded data. Therefore, you are able to analyze and evaluate it, as well as make optimum use of resources to enable high-performance operation without increasing cost by scaling up or scaling out.
– Jan Paul Langner (Scalefree)
