search
0
All Posts By

Dmytro Polishchuk

Dmytro Polishchuk is a Principal BI Consultant at Scalefree with six years of experience in business intelligence and cloud architecture. A CDVP2 and Snowflake certified expert, he specializes in large scale migrations and automated CI/CD pipelines for global banking and industrial groups. Dmytro combines finance driven analytical skills with deep expertise in dbt, Azure, and Data Vault 2.0 modeling.

dbt Fusion: The Next Generation of dbt Execution

dbt Fusion

dbt is evolving rapidly, and with the introduction of dbt Fusion, data teams are entering a new era of performance, efficiency, and intelligence. Built from the ground up, dbt Fusion represents a fundamental shift in how dbt projects are executed, validated, and optimized.

In this article, we’ll explore what dbt Fusion is, why it matters, and how its core capabilities—dialect-aware validation and state-aware orchestration—are changing the way modern data platforms operate.


What is dbt Fusion?

dbt Fusion is a next-generation execution engine for dbt, designed to overcome the limitations of dbt Core and unlock new capabilities for data teams. Rather than incrementally improving the existing engine, dbt Labs rebuilt the execution layer entirely.

One of the most important differences lies in its foundation: dbt Fusion is written in Rust, while dbt Core is built in Python. This change enables significantly better performance, especially for large-scale projects with complex dependency graphs.

But performance is only part of the story.

dbt Fusion introduces a native understanding of SQL across multiple dialects, allowing it to analyze queries more deeply than ever before. This enables advanced features like early error detection, improved lineage tracking, and smarter orchestration.

Importantly, dbt Fusion is designed to support the full dbt Core framework. Most existing dbt projects can run on Fusion with minimal changes, making adoption straightforward for many teams.

Note: Deprecated dbt Core functionality is not supported.

Why dbt Fusion Matters

dbt Fusion introduces two major innovations that directly impact day-to-day data work:

  • Dialect-aware SQL validation
  • State-aware orchestration

Together, these features significantly improve developer productivity, reduce execution time, and lower compute costs.

Dialect-Aware SQL Validation

Static SQL Analysis

One of the most powerful capabilities of dbt Fusion is its ability to perform static SQL analysis. Instead of simply rendering SQL and sending it to the data warehouse, Fusion builds a logical execution plan for every query during compilation.

This means that SQL correctness can be validated before any warehouse resources are used. As a result, many errors are caught early in the development process rather than during execution.

Handling Introspective Models

Not all SQL can be fully analyzed ahead of time. Some models rely on database-dependent macros, often referred to as introspective macros. Examples include:

  • get_column_values
  • star
  • unpivot

In these cases, dbt Fusion may defer part of the validation to the database itself, since the final structure depends on runtime information.

Why This Matters

Dialect-aware validation provides several key benefits:

  • Early error detection: Catch issues before execution
  • Improved developer experience: Faster feedback in the IDE
  • Precise column-level lineage: Better understanding of data flow
  • Foundation for advanced features: Enables orchestration and optimization

In practice, this means fewer failed runs, faster debugging, and more confidence in your transformations.

State-Aware Orchestration

The second major innovation in dbt Fusion is state-aware orchestration, which fundamentally changes how dbt jobs are executed.

Build Only What Changed

Traditionally, dbt runs rebuild models even if nothing has changed. dbt Fusion eliminates this inefficiency by detecting changes in both code and upstream data.

If no changes are detected, the model is skipped and the existing version is reused.

This results in:

  • Faster execution times
  • Reduced compute usage
  • Lower cloud costs

Shared Model State

dbt Fusion maintains a shared, real-time state at the model level. All jobs within the same environment can read and write to this shared state.

This allows dbt to determine whether a model has already been built and whether rebuilding it would produce a different result.

Concurrent Job Handling

In modern data platforms, multiple jobs often run at the same time. dbt Fusion is designed to handle this safely and efficiently.

It avoids unnecessary duplication by:

  • Preventing warehouse collisions
  • Reusing models across concurrent jobs
  • Ensuring consistency across executions

Works Out of the Box

One of the strengths of dbt Fusion is its ease of use. State-aware orchestration works automatically in most cases, without requiring additional configuration.

For advanced use cases, teams can still fine-tune behavior with more granular controls.

Efficient Testing (Beta)

dbt Fusion also introduces efficient testing, a feature currently in beta that optimizes how tests are executed.

Key improvements include:

  • Test result reuse: Avoid rerunning tests when results are unchanged
  • Query aggregation: Combine multiple tests into a single query
  • Reduced warehouse load: Lower compute costs

This makes testing faster and more cost-efficient, especially in large projects with extensive test coverage.

Performance and Cost Benefits

By combining Rust-based execution, advanced SQL analysis, and intelligent orchestration, dbt Fusion delivers measurable improvements:

  • Significantly faster runtimes
  • Reduced warehouse usage
  • Lower infrastructure costs
  • Improved developer productivity

For organizations managing complex data pipelines, these benefits can translate into substantial operational savings.

Compatibility with dbt Projects

dbt Fusion is designed to integrate seamlessly with existing dbt workflows.

Most projects can be migrated without major changes, as Fusion supports the core dbt framework. However, teams should be aware that deprecated features from dbt Core are not supported.

This makes it important to review and modernize older projects before transitioning.

Current State of dbt Fusion

At the time of writing, dbt Fusion is still in preview. While its capabilities are already impressive, some features may evolve as the engine matures.

Organizations considering adoption should monitor updates and test Fusion in controlled environments before full deployment.

Conclusion

dbt Fusion represents a major step forward in the evolution of dbt. By rethinking the execution engine from the ground up, it introduces powerful capabilities that go beyond incremental improvements.

With dialect-aware SQL validation, state-aware orchestration, and efficient testing, data teams can build pipelines that are not only faster, but also smarter and more cost-effective.

As the modern data stack continues to evolve, dbt Fusion is positioned to play a key role in shaping the future of analytics engineering.

Watch the Video

Meet the Speaker

Dmytro Polishchuk profile picture

Dmytro Polishchuk
Senior BI Consultant

Dmytro Polishchuk has 7 years of experience in business intelligence and works as a Senior BI Consultant for Scalefree. Dmytro is a proven Data Vault 2.0 expert and has excellent knowledge of various (cloud) architectures, data modeling, and the implementation of automation frameworks. Dmytro excels in team integration and structured project work. Dmytro has a bachelor’s degree in Finance and Financial Management.

Model Access in dbt: Governing Analytics at Scale with Groups

Model Access in dbt

As dbt projects grow, so do the challenges around collaboration, ownership, and reuse. What starts as a small analytics codebase can quickly evolve into a complex ecosystem of models shared across teams, domains, and even projects. Without clear boundaries, it becomes difficult to understand who owns what, which models are safe to reuse, and how to scale analytics without breaking downstream consumers.

This is where model access and groups come into play. Together, they form a powerful governance mechanism in dbt that helps teams structure responsibility, control visibility, and safely enable cross-project data sharing.

In this article, we’ll break down what groups are, how model access works, and how these features support scalable analytics and data mesh architectures.


What Are Groups in dbt?

A group in dbt is a named collection of nodes within a project. Groups provide a way to logically organize resources and define ownership, which becomes increasingly important as more people and teams contribute to the same dbt codebase.

Groups can include the following node types:

  • Models
  • Tests
  • Seeds
  • Snapshots
  • Analyses
  • Metrics

It’s important to note that sources and exposures are not included in groups.

There are a few key rules to understand:

  • Each node can belong to only one group
  • Every group must have a name
  • Every group must have an owner

The owner definition requires at least a name and an email address. Typically, the owner represents a team rather than an individual, such as an Analytics or Finance team. This explicit ownership makes responsibilities visible and helps clarify who to contact when questions or issues arise.

Beyond organization, groups play a critical role in how dbt enforces model access rules. In fact, model access is defined and evaluated in the context of groups.

What Is Model Access in dbt?

Model access is a governance feature in dbt that controls how and where a model can be referenced. It works alongside other governance capabilities such as model contracts and model versions.

By assigning an access level to each model, teams can define which models are internal implementation details and which are intended for broader reuse.

dbt provides three access levels:

Private

Private models are the most restrictive. They can only be referenced by other models within the same group.

This is ideal for intermediate or helper models that support a specific team’s logic but are not meant to be consumed outside that context.

Protected

Protected is the default access level in dbt. Protected models can be referenced by any group within the same project, or by other projects if the project is installed as a package.

This level supports collaboration within a single dbt project while still preventing accidental exposure across project boundaries.

Public

Public models are designed to be consumed outside the project they are defined in. These models can be referenced from other dbt projects using cross-project references.

Public access is especially important for organizations adopting a data mesh approach, where teams expose trusted data products for others to consume.

One important limitation to keep in mind: models materialized as ephemeral cannot be public. Since ephemeral models are not materialized in the warehouse, they cannot be safely shared across projects.

Cross-project public access requires the Enterprise tier of dbt Cloud.

How Groups and Model Access Work Together

Groups and model access complement each other. While groups define ownership and responsibility, access modifiers define visibility and usage.

Consider the following example configuration:

groups:
  - name: analytics
    owner:
      name: Analytics team
      email: [email protected]

models:
  - name: orders_per_supplier_country_customer
    config:
      access: private
      group: analytics

  - name: orders_per_customer
    config:
      access: protected
      group: analytics

  - name: orders_per_country
    config:
      access: public
      group: analytics

In this setup, all models belong to the analytics group, but each has a different access level.

The private model can only be referenced within the analytics group. The protected model can be referenced anywhere inside the same project. The public model can be referenced by other projects entirely.

In the dbt DAG and lineage views, private and public models are visually marked, making it easier to understand boundaries at a glance.

This combination allows teams to clearly communicate intent:

  • Which models are internal building blocks
  • Which models are safe for internal reuse
  • Which models are stable data products

Public Models and Cross-Project References

Public models enable collaboration across dbt projects. This is particularly valuable when different teams manage separate projects but still need to share data in a controlled way.

To make public models available to downstream projects, the upstream project must meet two conditions:

  • An environment defined as PROD or STG
  • At least one successful job run in that environment

These requirements ensure that dbt has generated the necessary metadata for downstream reference resolution.

In the downstream project, the upstream project is added as a dependency:

# dependencies.yml
projects:
  - name: hub_speak_dmytro_base

Once declared, public models from the upstream project can be referenced using a two-argument ref() function:

{{ ref('hub_speak_dmytro_base', 'dim_customer') }}

This pattern allows downstream teams to consume only the models explicitly marked as public, while all internal logic remains private or protected in the upstream project.

Why Model Access Matters for Data Mesh

Model access is a foundational capability for implementing data mesh with dbt.

By treating public models as stable interfaces, teams can publish data products with clear contracts and ownership. Downstream consumers rely on these models without needing to understand or depend on upstream implementation details.

At the same time, teams retain full control over what they expose. Internal experimentation and refactoring can happen safely behind private and protected boundaries.

This approach enables autonomy without chaos — a key principle of data mesh.

Conclusion

As dbt projects scale, governance becomes essential. Groups and model access provide simple but powerful tools to define ownership, enforce boundaries, and enable safe reuse of analytics models.

By thoughtfully combining groups with private, protected, and public access levels, teams can scale collaboration, support cross-project data sharing, and build reliable data products without sacrificing flexibility.

In upcoming sessions, we’ll demonstrate these concepts hands-on in dbt Cloud, showing how producer and consumer projects interact and how these relationships appear in the Catalog and lineage views.

If you’re working toward a scalable analytics or data mesh architecture, mastering model access in dbt is a crucial step.

Watch the Video

How to Monitor Data Reliability with dbt Source Freshness in dbt Cloud

How to Validate Data Freshness in dbt Cloud

Ensuring that your data is fresh, reliable, and aligned with your SLAs is one of the most important responsibilities of any analytics engineering or BI team. In modern data stacks, dbt Source Freshness plays a key role in validating that upstream systems are loading data as expected. When used properly, it helps teams identify delays, pipeline failures, or missing updates before they impact models and downstream reporting.

This article walks through a full demo of how to configure, run, and monitor Source Freshness checks in dbt Cloud. It builds on the fundamentals introduced in the first video of our series, where we explained what source freshness is, why it matters, and how dbt evaluates freshness. If you haven’t watched that introduction yet, we recommend doing so first.

In this second part, we go hands-on: reviewing source configurations, running freshness checks using both fields and custom SQL queries, applying optional filters, triggering warnings and failures, and inspecting the results in the dbt Cloud UI and Catalog. By the end, you’ll have a clear understanding of how to integrate freshness checks into your workflows and jobs to maintain a highly trustworthy data foundation.


Understanding the Source Freshness Configuration

The demo starts inside a dbt Cloud project with a YAML file containing our source definitions. For this walkthrough, we are working with a source called dbt_talk_demo_sources, which includes two tables:

  • customer_source
  • employee_source

Inside the configuration block, we define the core freshness thresholds:

  • warning_after: 30 minutes
  • error_after: 60 minutes

These settings tell dbt when to flag a source as slightly stale (warning) or critically outdated (error). They are typically aligned with SLAs and expectations for how often upstream data should be updated.

Using loaded_at_field

For the customer_source table, we use a basic configuration: the table includes an updated_at timestamp column, which dbt uses directly to calculate the freshness. However, the timestamps in this demo are recorded in CET (Europe/Berlin), which means dbt converts them to UTC before evaluating freshness. This highlights a common real-world consideration: time zones must always be handled consistently in freshness checks.

Using loaded_at_query

For employee_source, we use a different approach. This table does not store a timestamp column. Instead, the load timestamps are stored in a metadata table. To handle this, we configure a loaded_at_query—a SQL query that retrieves the latest load time externally. This method is often used when:

  • Timestamps come from an ETL metadata or logging table
  • Data loads use high-watermark patterns
  • You want more control over how freshness timestamps are calculated

In the demo, the query simply selects the MAX(updated_at) value from the metadata table. While simple, it demonstrates how flexible dbt is when working with custom data loading patterns.

Using Optional Filters

dbt also supports an optional filter configuration, which lets you skip certain rows when evaluating freshness. For example, if a table contains soft-deleted records or historical rows that should not count toward freshness checks, you can filter them out. In our demo, the filter excludes rows where deleted = TRUE, ensuring only active records contribute to the freshness calculation.

This becomes particularly useful when old records appear fresher than the latest valid ones, which could skew your results or hide actual issues.

Running Freshness Checks in dbt Cloud

With the configuration in place, we run our first freshness check via the CLI:

dbt source freshness

Before running the check, we insert new rows into the source tables so that the latest data delay is around 20 minutes. Since this is below both the warning and error thresholds, the run reports everything as green.

This confirms that both types of configurations—loaded_at_field and loaded_at_query—are working as expected.

Triggering a Warning

Next, we enable the earlier-mentioned filter configuration on customer_source. After filtering out the deleted rows, the next valid record has a delay of about 50 minutes. When we run:

dbt source freshness -s source:dbt_talk_demo_sources.customer_source

dbt reports a warning state, because the threshold of 30 minutes is exceeded. This demonstrates how filtering can impact the evaluation in meaningful ways.

Triggering a Failure

To understand how a failed freshness check behaves, we insert data with delays exceeding the 60-minute error threshold. Running the same command again produces an error state. The dbt output also shows the exact SQL query it executed to determine freshness—useful when troubleshooting unexpected results.

Including Freshness in dbt Cloud Jobs

dbt Cloud provides two ways to incorporate freshness checks into scheduled jobs:

Option 1: “Run Source Freshness” Checkbox

With this option enabled, dbt automatically runs dbt source freshness as the first step of the job. However, failures do not stop the rest of the job from executing. This mode is ideal when you want visibility but don’t want freshness violations to block model builds.

Option 2: Adding Freshness as a Job Step

Alternatively, you can include freshness checks as an explicit job step. In this case, if freshness fails, subsequent steps are skipped and the job fails. This is the preferred option when:

  • Data reliability is critical
  • Your models depend on up-to-date sources
  • You want strong enforcement of data SLAs

The demo shows examples of both approaches, so you can choose which one best fits your project needs.

Monitoring Freshness in the dbt Cloud Catalog

dbt Cloud makes it easy to monitor freshness results long after the run completes. In the Catalog, you can drill down into each source and see the most recent freshness status, including warnings and errors. This gives data teams better visibility into upstream issues without needing to dive into logs.

For example, in our demo environment, the Catalog displays a warning icon for dbt_talk_demo_sources. Opening the source reveals the individual freshness statuses for each table. This is especially helpful in larger projects where tracking freshness manually would be impractical.

Key Takeaways

This demo highlights the full power and flexibility of dbt Source Freshness in real-world analytics environments. Here are the main lessons:

  • Freshness thresholds provide an essential guardrail for data reliability.
  • loaded_at_field is simple when the timestamp is in the table.
  • loaded_at_query enables more advanced scenarios using external metadata.
  • Filters help refine which rows count toward freshness.
  • dbt distinguishes between OK, warning, and error states in a clear, actionable way.
  • Freshness checks can run as part of your dbt Cloud jobs with configurable strictness levels.
  • The dbt Cloud Catalog provides ongoing visibility into the freshness of all sources.

By combining these tools, you can ensure your source data stays timely, trustworthy, and perfectly aligned with your organization’s SLAs. This ultimately improves downstream analytics quality, enhances user confidence, and reduces the risk of building insights on outdated data.

Watch the Video

dbt Source Freshness: Ensuring Reliable and Timely Data in Your Pipeline

dbt Source Freshness

Data teams rely on timely, accurate, and complete data to support dashboards, KPIs, reporting, and data-driven decision making. But even the most advanced data models and transformation logic cannot fix one critical issue: stale or outdated upstream data. This is where dbt Source Freshness becomes one of the most valuable quality checks in your analytics engineering toolkit.

In this article, we take a close look at what dbt Source Freshness is, why it matters, how it works under the hood, and how you can configure and run freshness checks both locally and in dbt Cloud. If your organization depends on reliable data pipelines—or if you’ve ever discovered too late that a report was built on old data—this guide will help you avoid those costly surprises.


What Is dbt Source Freshness?

Source freshness in dbt is a built-in mechanism that measures how up-to-date data is in your defined source tables. While data transformations can apply logic, aggregations, and business rules, they inherently depend on data arriving on time. If source data is delayed, incomplete, or entirely outdated, every model downstream will reflect that delay.

dbt Source Freshness provides a simple, reliable indicator of whether the data you are working with is fresh enough to support your operational and analytical processes. It helps you answer one crucial question:

“Is the data I’m transforming actually the latest data available?”

When enabling freshness checks, dbt evaluates the most recent timestamp from a specified column in your source table and determines whether that timestamp violates your defined freshness thresholds. These thresholds act as data SLAs for your pipeline.

Why Source Freshness Matters

The importance of monitoring source data freshness cannot be overstated. When upstream data is stale, the consequences cascade throughout your entire analytics ecosystem. Dashboards may show outdated KPIs. Operational teams may make decisions based on incomplete numbers. Forecasts and reports may misrepresent the true state of the business.

One scenario that many data teams have encountered illustrates the problem perfectly: a business report runs on what everyone assumes is the latest data. After a few weeks, the team discovers that the upstream system had stopped updating its tables entirely. What appeared to be fresh data was actually months old. As a result, the report generated incorrect metrics for an extended period.

With source freshness monitoring in place, delays like these can be caught immediately. dbt highlights them clearly, allowing teams to:

  • Detect upstream system failures.
  • Identify delays in ingestion or replication pipelines.
  • Enforce data delivery SLAs with source system owners.
  • Stop inaccurate transformations from running on stale data.

Freshness checks turn what could be a hidden issue into a transparent, actionable signal.

How dbt Source Freshness Works

Source freshness configuration lives directly inside the YAML file where your source is defined. This design decision is intentional—freshness belongs to the source, not to downstream models. Each source or table can have its own customized freshness rules.

A typical source block with freshness configuration looks like this:

sources:
  - name: my_source
    tables:
      - name: orders
        freshness:
          warn_after: {hours: 24}
          error_after: {hours: 48}
        loaded_at_field: updated_at

Let’s break down the key components.

loaded_at_field

This is the timestamp column dbt uses to determine when the most recent record arrived. dbt queries this field, finds the newest timestamp, and calculates its age relative to the current time.

Important: dbt always evaluates freshness in UTC time. If your source system stores local timestamps (e.g., CET, EST), the value in loaded_at_field must be converted to UTC.

Thresholds: warn_after and error_after

Freshness thresholds define what “fresh enough” means. dbt compares the age of the newest record with these time limits and returns one of three statuses:

  • pass – the data is within the acceptable freshness window.
  • warn – the data is late but not critically late.
  • error – the data is beyond the maximum acceptable age.

These thresholds effectively act as SLAs, helping teams formalize expectations about data arrival. For example:

  • Warn after 24 hours.
  • Error after 48 hours.

If the source table hasn’t received new records in over 48 hours, dbt marks the freshness check as an error, signaling that the table is unreliable until updated.

What Happens During a Freshness Check?

When you run a freshness check, dbt performs a straightforward but effective procedure:

  1. dbt queries the loaded_at_field and finds the most recent timestamp.
  2. It calculates the time difference between that timestamp and the current UTC time.
  3. It compares the age of the data to your defined thresholds.
  4. It returns a pass, warn, or error result.

This process is intentionally lightweight and fast. It avoids unnecessary complexity while giving teams a dependable, high-value signal about upstream data timeliness.

How to Run Freshness Checks in dbt

Running a freshness check in dbt is simple. The main command is:

dbt source freshness

This command evaluates freshness for all sources that have freshness configurations defined. You can also target a specific source or table:

dbt source freshness --select source:my_source
dbt source freshness --select source:my_source.orders

When executed, dbt displays the freshness status for each table along with metadata such as:

  • The latest timestamp found.
  • The calculated age of the data.
  • The threshold values used.

Running Freshness Checks in dbt Cloud

dbt Cloud makes managing freshness checks even easier. You can create a dedicated job that runs only freshness checks, or you can add freshness as a step in a larger job. This enables automatic monitoring without requiring manual execution.

Once the job completes, results appear directly in the dbt Cloud UI. For each table, you can see:

  • The age of the most recent record.
  • Whether the table passed, warned, or errored.
  • When the freshness check was last executed.

You can also inspect the detailed logs to understand exactly how dbt evaluated each source.

Why Freshness Checks Should Be a Standard Practice

In modern analytics engineering, data reliability is just as important as transformation logic. Freshness checks are a lightweight yet powerful way to ensure that your source systems are delivering data on time.

Without freshness checks, data issues may go unnoticed until they have already impacted dashboards, stakeholder decisions, or downstream processes. With freshness monitoring enabled, you gain visibility into problems early, allowing your team to respond quickly and prevent incorrect reporting.

As data ecosystems grow more complex—with multiple ingestion pipelines, third-party APIs, and event-based systems—freshness checks provide a simple, standardized way to maintain trust in your data.

Watch the Video

How to Publish Power BI Reports with the dbt Semantic Layer

Publishing Power BI Reports with the dbt Semantic Layer

Welcome back to our two-part guide on connecting Power BI to the dbt Semantic Layer. In Part 1, we demonstrated how to connect Power BI Desktop to dbt Cloud and build a simple dashboard using semantic metrics. That was just the beginning.

In this article, we continue the journey by publishing that report to Power BI Service and configuring the On-premises Data Gateway to ensure the connection to the dbt Semantic Layer remains alive. This is a crucial step for moving from a personal development workflow to a shared, production-ready BI environment.


Why Power BI Service Needs a Gateway

When you publish a Power BI Desktop report connected to the dbt Semantic Layer, the connection details don’t automatically carry over to Power BI Service. Instead, you’ll likely see an error message such as “The model cannot be loaded”. This happens because:

  • Power BI Service cannot directly use the desktop connection credentials.
  • A secure, always-online connection is required to keep queries alive.

The solution is to use the On-premises Data Gateway. This component securely bridges Power BI Service with your data sources—whether on-premises or cloud-based—so your dashboards can refresh seamlessly.

Step 1: Publish the Report to Power BI Service

We’ll start where we left off in Part 1, with a working report in Power BI Desktop named DEMO – dbt Semantic Layer.

  1. Open the report in Power BI Desktop.
  2. Click the Publish button.
  3. Choose a workspace (for this demo, we’ll use “My workspace”).
  4. Open Power BI Service and locate the published report.

At this stage, you’ll notice that the report cannot load data. This is expected and is exactly why we need to configure the gateway.

Step 2: Install the On-Premises Data Gateway

To enable the connection, download and install the On-premises Data Gateway in Standard mode. The dbt Semantic Layer connector is not supported in Personal mode at this time.

Download link: Get the Power BI Gateway (Microsoft).

During installation:

  • Choose Standard mode.
  • Follow the guided steps and complete the setup.
  • Launch the gateway after installation.
  • Sign in with your Power BI Service account to register the gateway.

At this point, your gateway should show as online and ready to use.

Step 3: Configure Custom Connector Support

The dbt Semantic Layer connection is enabled through a custom Power BI connector. This requires a manual file copy:

  1. Locate the connector file on your machine. By default, it is stored in:
    C:\Users\<YourUsername>\Documents\Power BI Desktop\Custom Connectors\dbtSemanticLayer.pqx
  2. Copy this file into the gateway’s custom connector directory:
    C:\Windows\ServiceProfiles\PBIEgwService\Documents\Power BI Desktop\Custom Connectors
  3. Restart the gateway if needed. The connector should now be detected under the Connectors section of the gateway.

This step is critical—without copying the connector, the gateway will not recognize the dbt Semantic Layer.

Step 4: Configure the Gateway in Power BI Service

With the gateway online and the custom connector installed, it’s time to configure the connection inside Power BI Service:

  1. In Power BI Service, navigate to Settings → Manage Connections and Gateways.
  2. Select your gateway from the list of available gateways.
  3. Go to the gateway Settings and allow the use of Custom Connectors. Without this option, the connection will fail.
  4. Next, go to Settings → Power BI Settings → Semantic Models.
  5. Locate your published report (DEMO – dbt Semantic Layer).
  6. Under Gateway and Cloud Connections, add your connector to the gateway and provide the required host, environment ID, and service token values.

Once these steps are complete, your Power BI Service report should start loading live data from the dbt Semantic Layer.

Step 5: Validate the Connection

Open your report in Power BI Service. This time, instead of the “model cannot be loaded” error, you should see the data loading and the dashboard visuals appearing. This confirms that the gateway is successfully maintaining the connection to the dbt Semantic Layer.

Summary of the Workflow

Let’s recap what we’ve achieved across both parts of this series:

  1. Part 1: Connected Power BI Desktop to the dbt Semantic Layer and built a working dashboard using semantic metrics.
  2. Part 2: Published the report to Power BI Service, configured the On-premises Data Gateway in Standard mode, enabled custom connectors, and restored connectivity to the dbt Semantic Layer.

The end result? A Power BI dashboard that queries dbt metrics live, end-to-end, even in the Service environment.

Best Practices

While the demo used a local laptop, in production environments the On-premises Data Gateway should be installed on a reliable, always-on machine, such as:

  • An on-premises server.
  • A cloud-hosted virtual machine (e.g., Azure VM, Amazon EC2).

This ensures the connection remains stable, and report refreshes happen as scheduled without interruption.

Conclusion

Connecting Power BI Service to the dbt Semantic Layer is a powerful way to extend governed, consistent metrics to your entire organization. By configuring the On-premises Data Gateway and enabling custom connectors, you ensure that your published reports continue to deliver real-time insights based on dbt’s semantic definitions.

If this guide was helpful, make sure to check out Part 1 if you haven’t already, and stay tuned for more deep dives into the dbt platform and BI integrations.

Additional Resources

Watch the Video

How to Connect to the dbt Semantic Layer Through Power BI

Connecting Power BI to the dbt Semantic Layer

As organizations increasingly rely on data-driven decision making, the ability to connect business intelligence tools directly to semantic layers becomes essential. One of the most common requests we’ve heard from our community is: “How can I connect Power BI to the dbt Semantic Layer to expose metrics?”

In this guide, we’ll walk through the entire process of setting up and connecting Power BI with the dbt Semantic Layer. By the end, you’ll be able to query dbt metrics directly in Power BI and build interactive dashboards that stay in sync with your semantic models.


Why Connect Power BI with the dbt Semantic Layer?

The dbt Semantic Layer allows teams to define business metrics and dimensions in one central place. Instead of duplicating logic across BI tools, analysts and business users can rely on consistent definitions for KPIs such as revenue, churn, or order count. When Power BI is connected to this layer, dashboards automatically reflect the same trusted metrics already defined in dbt.

This integration helps:

  • Maintain consistency in metric definitions across the organization.
  • Reduce manual work for analysts when creating Power BI reports.
  • Ensure real-time access to governed data models.

Pre-Requisites

Before starting, make sure you have the following:

  • A working dbt Cloud project with a configured Semantic Layer.
  • Permission to create or access a Service Token in dbt Cloud.
  • Installed version of Power BI Desktop.
  • Internet access to download the dbt Semantic Layer Power BI connector.

Step 1: Review the dbt Semantic Layer Setup

If you’re not familiar with how the dbt Semantic Layer is configured, check out Hernan Revale’s detailed session on setting up metrics and dimensions in dbt Cloud:
Watch the dbt Semantic Layer session here.

Step 2: Collect Required Credentials in dbt Cloud

Navigate to your dbt Cloud Dashboard and head to:

  • Settings → Semantic Layer or Settings → Edit Semantic Layer

Here, confirm or configure the following:

  1. Credentials for the deployment environment where your semantic models run.
  2. A Service Token linked to the Semantic Layer. If you don’t have permission, ask your dbt admin to create one.
  3. Your Environment ID and Host, which will be used in Power BI during connection setup.

Important: Store your Service Token securely. You’ll need it to authenticate Power BI.

Step 3: Install the dbt Semantic Layer Power BI Connector

Download the Power BI connector for dbt Semantic Layer from the official documentation:
Download the connector here.

Run the installer and follow the on-screen steps. After installation, verify it by checking the list of available drivers in the ODBC Data Sources. The dbt Semantic Layer connector should now appear in the list.

Step 4: Connect Power BI to the dbt Semantic Layer

Now that everything is set up, it’s time to establish the connection:

  1. Open Power BI Desktop and start a blank report.
  2. Search for dbt Semantic Layer in the available connectors.
  3. Accept the beta notice (as the connector is still under development).
  4. Provide the required details:
    • Host
    • Environment ID
    • Service Token
  5. Choose DirectQuery (Import is not yet supported).
  6. Click Load to access your metrics.

Step 5: Build a Simple Dashboard

Once the semantic model is loaded, you’ll see your dbt metrics in the Power BI fields pane. You can now build visualizations just like you would with any other dataset. For example:

  • Create a stacked column chart with “Orders Total” on the Y-axis and “Customer Region” on the X-axis.
  • Add slicers for Region, Market, or Segment to filter the data dynamically.
  • Include a card visualization to highlight key metrics such as total revenue.

At this point, your Power BI dashboard is fully connected to the dbt Semantic Layer. Metrics are updated live and reflect the definitions you’ve configured in dbt Cloud.

Step 6: What’s Next?

In this tutorial, we focused on connecting Power BI Desktop to the dbt Semantic Layer. In the next part of this series, we’ll publish the report to Power BI Service and explain how to retain dbt connectivity in a collaborative environment.

Stay tuned for the next video and article, and don’t forget to subscribe to our channel for updates.

Conclusion

Connecting Power BI to the dbt Semantic Layer is a powerful way to bring consistent, governed metrics directly into your BI environment. With a few configuration steps, you can ensure that every report and dashboard your team creates in Power BI leverages the same trusted metric definitions managed in dbt.

This setup not only accelerates dashboard creation but also strengthens data governance across your organization. As the connector continues to evolve, we can expect even smoother integrations and more functionality in the near future.

Additional Resources

Watch the Video

DBT Snapshots as Sources for Data Vault Powered EDW

DBT Snapshots Question

This topic was inspired by a viewer’s question: “How can you build a Data Vault data warehouse downstream from dbt snapshots?”


What is a Snapshot in dbt?

A snapshot in dbt is a tool that captures and preserves changes in data for tables that may be updated over time. This enables historical analysis and ensures that changes in data are properly recorded.

Key Features of dbt Snapshots

  • Definition: Snapshots capture historical data by preserving changes over time.
  • Purpose: They allow analysts to look back at previous versions of data, supporting historical analysis, auditing, and compliance.
  • Mechanism: Snapshots are built on Slowly Changing Dimensions (SCD) Type 2.
  • Value: Essential for auditing, regulatory compliance, and data analysis.

To create snapshots, use the command:

dbt snapshot

They are also included in the broader dbt build command. Notably, snapshots cannot be rebuilt in a direct way to prevent accidental loss of historical data.

Metadata Fields

dbt adds four key metadata fields to snapshot tables:

  • dbt_scd_id: Unique identifier for change tracking.
  • dbt_updated_at: Timestamp of the latest update.
  • dbt_valid_from: Start timestamp of the record.
  • dbt_valid_to: End timestamp (when applicable).

Starting with dbt version 1.9, these field names are customizable.

Snapshot Strategies in dbt

  • Timestamp Strategy: Tracks changes using an updated_at column. Recommended due to its performance.
  • Check Strategy: Compares column values for changes. Useful when there is no reliable timestamp column but can be less efficient.

Handling Hard Deletes

By default, dbt does not track hard deletes. However, enabling invalidate_hard_deletes: true ensures that deleted records are marked with an updated dbt_valid_to timestamp. This is crucial for effectivity satellites in Data Vault modeling.

Demo: Data Vault Integration with dbt Snapshots

Source Data: Snowflake Sample Data

For the demo, we use Snowflake’s TPCH sample dataset:

  • Database: snowflake_sample_data
  • Schema: tpch_sf1
  • Selected Tables: customer, orders, part, lineitem

Each table has a corresponding dbt snapshot:

  • snap_customer
  • snap_orders
  • snap_part
  • snap_lineitem

The snapshot configurations:

  • Strategy: Check (due to lack of reliable timestamp columns)
  • Hard Deletes: Enabled (invalidate_hard_deletes: true)

Target: Raw Data Vault Model

The Data Vault model consists of:

  • Hubs: customer_h, order_h, part_h
  • Links: orders_l (customer-order relationship), orders_parts_l (order line items)
  • Satellites: customer_s, order_s, part_s, orders_parts_s
  • Effectivity Satellites: Track historical changes with dbt_valid_from and dbt_valid_to

During the demo, we focus on the customer entity, tracking how changes in the customer table are reflected in its corresponding Data Vault satellites.

Conclusion

Using dbt snapshots as a persistent staging area (PSA) for a Data Vault-powered EDW enables accurate historical tracking. The combination of snapshot strategies and effectivity satellites ensures that data lineage and changes are well-documented and auditable. By leveraging Snowflake’s sample datasets, we can efficiently test and refine Data Vault implementations.

Watch the Video

Microbatch Incremental Models: A New Approach to Large Time-Series Data

What is a Microbatch?

Microbatch is an innovative incremental strategy designed for large time-series datasets. Introduced in dbt Core version 1.9 (currently in beta), it complements existing incremental strategies by offering a structured and efficient way to process data in batches.


Key features of Microbatch include:

  • Utilizes a time column to define batch ranges.
  • Supports reprocessing failed batches.
  • Auto-detects parallel batch y
  • Eliminates complex conditional logic for backfilling.

However, it’s not suitable for datasets lacking a reliable time column or requiring fine-grained control over processing logic.

How Microbatches Work

Microbatching works by splitting model processing into multiple queries (batches) based on:

  • event_time: The time column defining batch ranges.
  • batch_size: The time period for each batch (hour, day [default], month, year).

Each batch functions as an independent, atomic unit, meaning:

  • Batches can be processed, retried, or replaced individually.
  • Parallel execution enables separate, idempotent batch processing.

Batch replacement strategies vary by database adapter:

  • Postgres: Uses merge.
  • BigQuery, Spark: Uses insert_overwrite.
  • Databricks: Uses replace_where.
  • Redshift, Snowflake: Uses delete + insert.

Microbatch Model Configurations

When setting up a Microbatch model, the following configurations are required:

  • event_time: Specifies the time column in UTC.
  • batch_size: Defines batch granularity (hour, day, month, year).
  • begin: Sets the start point for initial or full-refresh builds.

Optional configurations include:

  • lookback: Processes prior batches for late-arriving records.
  • concurrent_batches: Controls parallel execution (auto-detected by default).

Running Batches in Parallel

Parallel execution is automatically detected based on batch conditions and adapter support. However, users can override this behavior using the concurrent_batches setting.

Parallel execution is possible when:

  • The batch is neither the first nor last in the sequence.
  • The database adapter supports parallel execution.
  • The model logic does not depend on execution order.

How to Backload Data

Backloading allows reprocessing historical data within a specific time range using the following command:

dbt run --event-time-start "2025-02-01" --event-time-end "2025-02-03"

This ensures that only batches within the defined range are processed independently.

Microbatch vs. Other Incremental Strategies

Microbatch differs from traditional incremental strategies by:

  • Using independent queries for time-based batches.
  • Eliminating the need for is_incremental() and complex SQL logic.
  • Automatically selecting the most efficient operation (insert, update, replace) for each platform.

Conclusion

Microbatch is a powerful new approach to incremental data processing in dbt Core. By breaking down large datasets into manageable, parallelizable chunks, it simplifies data modeling while improving efficiency and scalability. However, it is essential to consider whether Microbatch suits your data pipeline’s requirements before implementing it.

Watch the Video

Snapshots in dbt

Watch the Video

Snapshots in dbt: A Quick Overview

dbt snapshots allow you to “look back” at historical data by capturing changes in your database tables. This is achieved by implementing type-2 Slowly Changing Dimensions (SCDs), which track how a row has changed over time. For example, you can keep track of an order’s status as it moves from ‘pending’ to ‘shipped’ to ‘delivered’.


How Snapshots Work

When you run dbt snapshot, it creates a new table with the same columns as your source table, plus additional metadata columns like dbt_valid_from and dbt_valid_to. On subsequent runs, dbt updates the dbt_valid_to column for changed records and adds new records with dbt_valid_to set to null.

dbt offers different strategies for detecting changes, including comparing timestamps, specific column values, or a unique key. You can also configure dbt to track deletions.

Snapshots Best Practices

  • Store snapshots in a separate schema to keep your historical data organized.
  • Snapshot raw data using the source function and select all columns.
  • Avoid joins in your snapshot queries; instead, create separate snapshots and join them downstream.
  • If you need to perform transformations, do so in ephemeral models before snapshotting.
  • Schedule snapshots to run frequently to capture changes regularly.

By following these best practices, you can ensure that your dbt snapshots are accurate, efficient, and easy to maintain.

The Potentials of Microsoft Fabric for Business Intelligence Solutions

Microsoft Fabric

Microsoft Fabric for Business Intelligence

Microsoft Fabric is an all-in-one cloud-based analytics platform that provides a unified environment for data professionals and business users to collaborate on data solutions. It is a powerful analytics platform that helps businesses automate workflows, improve productivity, and gain insight from their data.

In today’s data-driven world, businesses are increasingly turning to business intelligence (BI) solutions to gain insight from their data. BI solutions can help businesses improve their decision-making, optimize their operations, and gain a competitive edge.

The Potentials of Microsoft Fabric for Business Intelligence Solutions

Microsoft Fabric is a new and innovative data analytics platform that has the potential to revolutionize the way businesses make decisions. With Fabric, organizations can ingest, store, process, and analyze all of their data in one place, using a unified set of tools and services. This makes it possible to get insights from data faster and easier than ever before. We will explore the potential of Microsoft Fabric for business intelligence solutions. We will discuss how Fabric can be used to improve data quality, streamline analytics workflows, and deliver insights to users. This webinar is interesting for everyone wanting to learn more about how to use Microsoft Fabric to get more value from data. And even more interesting for Data engineers and analysts, Business intelligence professionals, and IT decision-makers. Register now for this free webinar and learn how Microsoft Fabric can help you take your business intelligence solutions to the next level!

Watch webinar recording

What to expect

This newsletter will take you on a journey to discover the transformative power of Microsoft Fabric for business intelligence solutions. You will explore the various workloads and experiences that Microsoft Fabric offers, gaining a comprehensive understanding of its capabilities. You will also uncover the benefits that Microsoft Fabric brings to data-driven decision-making, enabling you to make informed choices that propel your business forward. Finally, you will delve into the potential that Microsoft Fabric holds for enhancing business intelligence solutions, empowering you to unlock new levels of insight and decision-making capabilities.

To dive even deeper, watch the webinar recording about this topic for free. Click here to register.

What is Microsoft Fabric?

Microsoft Fabric is an all-in-one cloud-based analytics platform that provides a unified environment for data professionals and business users to collaborate on data solutions. Fabric offers a suite of integrated services that enable you to collect, store, process, and analyze data in a single platform, which is built on a foundation of Software-as-a-Service (SaaS).

Microsoft Fabric provides tools for people with all levels of data expertise and connects with the tools businesses use to make decisions.
Fabric itself is an umbrella for the following Microsoft cloud-based services that constitute Microsoft Analytics Portfolio:

  • Azure Data Factory
  • Azure Event Hubs
  • Azure Data Explorer
  • Azure Artificial Intelligence
  • Azure Databricks
  • Azure Synapse Spark Pools
  • Azure Synapse Analytics
  • and Microsoft Power BI

The above items have been re-tooled and taken to the next level inside the Microsoft Fabric.

Workloads of Microsoft Fabric
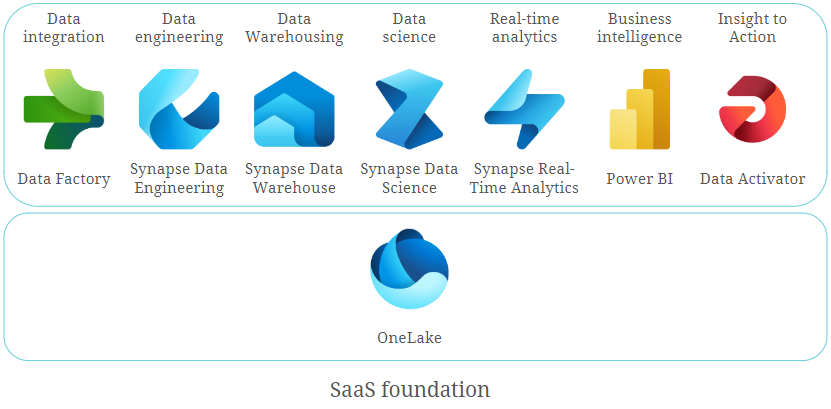
Fabric includes the following workloads or experiences:

  • Data integration
  • Data Engineering
  • Data Warehousing
  • Data Science
  • Real-time analytics
  • Business intelligence
  • Insight to action

The foundation of these experiences in Fabric is the data lake, which is known as OneLake. The below picture illustrates the concept of Microsoft Fabric.

Microsoft Fabric

Let’s review every component of Fabric in a bit more detail.

Data Integration

Microsoft Fabric’s data integration workload, called Data Factory, brings data movement capabilities to both dataflows and data pipelines.

  • Dataflows offer flexible and user-friendly ways to transform data with over 300 transformations. It is built on the familiar Power Query experience, which is available in several Microsoft products and services, such as Excel, Power BI, Power Platform, and others.
  • Data pipelines let you create flexible data workflows to meet your organizational goals. You can use the built-in data orchestration features to refresh your dataflows, process large datasets, and define complex control flow pipelines.

Data Engineering

Data Engineering Experience or Synapse Data Engineering offers a top-tier Spark platform, fostering rich authoring experiences. This empowers data engineers to conduct extensive data transformations and facilitates widespread access to data via the lakehouse.

Microsoft Fabric provides various data engineering capabilities to ensure that your data is easily accessible, well-organized, and of high quality. From the data engineering homepage, you have the following options:

  • Lakehouse
    Create and manage Lakehouse. Lakehouse is a logical location in OneLake where you store and manage structured and unstructured data using various tools and frameworks. You can even mount an external storage account into your Lakehouse with the Shortcut feature.
    You can use the SQL Endpoint to query Lakehouse tables, but only read-only queries are supported.
  • Notebook
    Write and run code in popular programming languages, like Python, R, and Scala. Leverage notebooks for data ingestion, transformation, analysis, and other data processing tasks.
  • Environment
    Within an environment, you have the flexibility to choose from a variety of Spark runtimes, configure your computational resources, and incorporate libraries – either from public repositories or by uploading locally-built custom libraries. Attaching these environments to your notebooks and Spark job definitions is a seamless process.
  • Spark Job Definition
    Define, schedule, and manage Spark jobs to process big data in your lakehouse, apply transformation logic to the data, and more.
  • Data Pipeline
    Design and orchestrate pipelines to copy data into your lakehouse, schedule Spark jobs and notebooks to process high-volume data, and automate data workflows via integration with Data Factory.

Data Warehousing

Data warehouse or Synapse Data Warehouse is a lake-centric repository for storing and analyzing structured data built on a distributed processing engine. Data warehousing workload benefits from the rich capabilities of the SQL engine over an open Delta Lake format, which are parquet files published as Delta Lake Logs and stored in OneLake. Delta Lake Logs enable ACID transactions. A warehouse can contain only structured data. Here you can not only read data with SQL but also execute inserts and updates.

Data Science

The Data Science Experience, or Synapse Data Science, allows for the creation, deployment, and operationalization of machine learning models. Data scientists are empowered to enrich organizational data with predictions and allow business analysts to integrate those predictions into their BI reports. Data Science in Fabric provides you with the following options:

  • ML model
    Leverage machine learning models to forecast results and identify irregularities within datasets.
  • Experiment
    Engage in the experimentation phase by generating, executing, and monitoring the evolution of various models for validating hypotheses.
  • Notebook
    Utilize the Notebook feature to delve into data exploration and construct machine learning solutions through Apache Spark applications.
  • Environment
    This option has the same purpose as in Data Engineering experience.

Real-Time Analytics

Real-Time Analytics in Fabric or Synapse Real-Time Analytics is a fully managed big data analytics platform optimized for streaming and time-series data. It utilizes a Kusto Query Language (KQL) — an engine with exceptional performance for searching structured, semi-structured, and unstructured data. Real-Time Analytics is fully integrated with the entire suite of Fabric products for data loading, data transformation, and advanced visualization scenarios. There are three components of the Real-Time Analytics in Fabric:

  • KQL Database — the place to store streaming data. It uses OneLake as the underlying storage system.
  • KQL Queryset — run queries on your data to produce shareable tables and visuals. Save, manage, export, and share KQL queries. KQL Queryset is an analog of SSMS for a SQL Database.
  • Eventstream — capture, transform, and route real-time event stream to various destinations in the desired format with no-code experience. It is a hub of streaming data, where multiple sources (including Event Hub) and various destinations (including KQL database) can be set.

Business Intelligence

From the BI side, Fabric has Power BI, one of the world’s leading Business Intelligence platforms. It represents a set of services, tools, and connectors that turn your data into interactive visual reports and dashboards. In Fabric, there are some new features and enhancements to work with Fabric objects and experiences. Among these are:

  • Direct Lake mode connection that is based on loading parquet-formatted files directly from a data lake without the need to import the data into a data set.
  • Integration with Synapse Real-Time Analytics to produce real- or near-real-time reports.
  • Semantic link that allows loading data from Power BI data sets into Data Science experience and others.

Insight to Action

Insight to action in Fabric offers Data Activator, which is an experience for automatically triggering actions when certain conditions are met in the incoming data. It works with Eventstreams for real-time data and Power BI for batch data. There are three possible actions that can be configured after the conditions are detected:

  • Email — get notified by email.
  • Teams message — send a notification to an individual or a channel in Teams.
  • Custom action — perform a custom action to call Power Automate workflow.

Data Lake

OneLake is the central component of all Fabric services. It is a built-in, unified data lake that stores all organizational data and is used by all Fabric experiences. OneLake uses ADLS Gen2 as its underlying storage.

To simplify management across the organization, OneLake is organized hierarchically. Each tenant has only one OneLake instance, which provides a single namespace that extends over users, regions, and even clouds. For easy handling, data in OneLake is divided into manageable containers.

Similar to Microsoft OneDrive, any developer or business unit in the tenant can create their own workspaces in OneLake. They can ingest data into their own lakehouses, and start processing, analyzing, and collaborating on the data. All Fabric experiences are bound to and operate on top of OneLake.

So What Are Microsoft Fabrics Potentials?

Microsoft Fabric has the potential to revolutionize the way that businesses build and deploy business intelligence solutions. Here are some of the key potentials:

  • Unified data platform: Microsoft Fabric provides a unified data platform for storing and analyzing all types of data, including structured, semi-structured, and unstructured data. This means that businesses can use a single set of tools and services to manage all aspects of their data pipeline, from data ingestion and preparation to data analysis and visualization. This can help to reduce complexity and improve efficiency.
  • End-to-end analytics: Microsoft Fabric provides a complete set of capabilities for building and deploying end-to-end analytics solutions. This includes data engineering, data science, data warehousing, and business intelligence. This simplifies the development and deployment of analytics solutions and reduces the need for specialized expertise.
  • AI-powered insights: Microsoft Fabric embeds AI and machine learning capabilities throughout the platform. This can be used to automate tasks, generate insights, and improve the accuracy of predictions. This can help businesses to make better decisions faster.
  • A unified platform accommodating diverse expertise: Data professionals with varying backgrounds can leverage their skill sets to collaborate on a singular data solution. This inclusive environment allows individuals from different disciplines and proficiency levels to contribute their expertise to a common data project.
  • Reduced data silos: It eliminates the need to move data between various systems, making it easier to get a complete view of your business.
  • Reduced costs: Microsoft Fabric can help businesses reduce the costs associated with building and deploying business intelligence solutions. This is because it eliminates the need to purchase and maintain multiple systems and it provides a number of features that can automate tasks and improve efficiency.

In essence, Microsoft Fabric holds the promise of simplifying and rendering the development and deployment of robust business intelligence solutions more accessible and cost-effective for businesses, regardless of their scale or size.

Conclusion

Microsoft Fabric represents a paradigm shift in the realm of business intelligence solutions. With its unified data platform, end-to-end analytics capabilities, and AI-driven insights, Fabric streamlines data management from collection to visualization. The platform’s ability to cater to diverse skill sets and backgrounds, reducing data silos, and automating tasks illustrates a remarkable potential to revolutionize the industry.

Through its components, such as Data Factory, Data Engineering, Data Warehousing, Data Science, Real-Time Analytics, Power BI, Data Activator, and the robust foundation of OneLake, Microsoft Fabric promises a future where businesses can efficiently harness the power of data to make informed decisions and drive innovation. Ultimately, it has the potential to democratize powerful business intelligence solutions, making them more accessible and cost-effective for enterprises of all scales.

Technical Tests of a Data Vault Powered EDW

Data Vault Powered EDW

In this newsletter, we’ll discuss and make an overview of different methods and approaches when performing technical tests of a Data Vault-powered EDW.

The testing approaches described below are aimed to ensure the integrity, reliability, accuracy, consistency, and auditability of the data loaded into your Data Vault entities as well as the information marts built on top of them. All to ensure that it is safe for your business to make decisions based on that data.

Technical Tests and Monitoring of a Data Vault powered EDW

In this webinar, our experts will a give you an overview of different methods and approaches of technical testing and monitoring of a Data Vault powered EDW. The testing approached to be discussed are suitable for different layers of your EDW solution, starting from extracting data from sources to the landing zone/staging area (Extract and Load) and ending with information marts used by end users in their BI reports. The main focus of our webinar though is testing the Data Vault 2.0 entities in the Raw Vault and Business Vault layers. The monitoring focuses on providing insights into the performance of your EDW. Starting with the modeling approach of the metrics vault and metrics marts, the areas of the source data of these entities will be covered. This data captured provides information about the process execution of your ELT processes, as well as error information. By inspecting the error marts, you can track your errors, find the root cause or boost your performance by taking performance metrics into account.

Watch Webinar Part 1Watch Webinar Part 2

What to expect

You will receive an overview of testing approaches suitable for different layers of your EDW solution starting from extracting data from sources to the landing zone/staging area (Extract and Load) and ending with information marts used by end users in their BI reports. Additionally, we will discuss test automation and its importance for continuous integration of your Data Vault-based EDW. That stated, the main focus of this newsletter though is testing the Data Vault entities in the Raw Vault and Business Vault layers.

Testing Data Extraction Process

Regardless of where the data extraction takes place – data source, persistent staging, transient staging – the main goal of testing at this phase is to prove that there is no leakage while transporting or staging the data. Comparing the input data and the target data ensures that the data has not been accidentally or maliciously erased, added, or modified due to any issues in the extraction process.
Checksums, hash totals, and record counts shall be used to ensure the data has not been modified:

  • Ensure that checksums over the source dataset and the target staging table are equal
  • Ensure that the numerical sum of one or more fields in a source dataset (aka hash total) matches the sum of the respective columns in the target table. Such sum may include data not normally used in calculations (e.g., numeric ID values, account numbers, etc.)
  • Make sure the row count between the source and the target staging table matches

Testing Data Vault

The core part of your Data Vault-powered EDW solution is a Raw Data Vault which contains raw and unfiltered data from your source systems that has been broken apart and loaded into hubs, links, satellites, and other Data Vault-specific entities based on business keys. This is the first point in the data pipeline in which the data lands in the Data Vault-modeled entities . Thus, specific tests are required to ensure consistency and auditability of the data after the Raw Data Vault is populated. The below test approaches are valid for Business Vault entities as well.

Testing Hubs

Hubs store business keys by separating them from the rest of the model. A hub is created for every business object. It contains a unique list of keys representing a business object that have the same semantic meaning and granularity. The business objects residing in a hub are then referenced from other Data Vault entities through hash keys calculated during the staging phase.

As such, the following tests are necessary to perform on hubs to ensure their consistency:
For a hub with a single business key, tests should ensure that:

  • A hub contains a unique list of business keys (primary key (PK) test)
  • A business key column contains no NULL or empty values (except when business key is composite)

If a hub has a composite business key, ensure that:

  • The combination of the values in the business key columns are unique (PK test)
  • Business key columns don’t contain NULL or empty values all at once

The validity of the latter point also depends on the nature of the business objects itself. It can also be that NULLs or empty values are not allowed in any of the business key columns.

For the both kinds of hubs, ensure that:

  • Hash key column contains:
    • Unique list of values (PK test)
    • No NULLs or empty values

Testing Links

A typical link defines relationships between business objects by storing unique combinations of hash keys of the connected hubs. The primary key of the link or link hash key uniquely identifies such a combination. Thus, link tests should check that:

  • The combination of connected hub references (hub hash keys) is unique (PK test)
  • Every hub hash key value exists in the referenced hub
  • Hub references do not contain NULLs or empty values

Regarding the last bullet point, note that the NULLs and empty values in hub references, as well as in hash key columns of other Data Vault entities, are replaced with zero keys.
For transactional (non-historized) data, transactional key columns should be included into the uniqueness tests in addition to columns with hub hash keys. Make sure that transactional keys are populated as well. Such transactional keys are usually not hashed since, as a rule, no hubs for transactions are created.
And, as for hubs, make sure that the link hash key column contains unique values and there are no NULLs and empty values.

Testing Satellites

Satellites store descriptive information (attributes) for business objects (residing in hubs) or relationships between business objects (residing in links). One satellite references either one hub or one link. Since descriptive information for business objects and relationships between them may change over time, a load date timestamp of a satellite record is added to the primary key of a satellite.

With the above said, tests for a satellite should make sure that:

  • The combination of a hub/link reference (the Hash Key) and the load date timestamp of a record is unique (PK test)
  • Every hub or link hash key value exists in the referenced hub or link
  • Hub or link references do not contain NULL or empty values

Multi-active satellites contain multiple active records at the same time. Thus, additional key columns (for example, Type Code, Sequence, etc.) are needed to uniquely identify a record. These additional key columns have to be part of the unique test of a multi-active satellite. Additionally, they should be tested for the absence of NULL and empty values.
The approach for testing a non-historized satellite also differs a bit from testing its standard sibling. A non-historized satellite is a special entity type that contains descriptive attributes for every corresponding record in a non-historized link. A primary key of a non-historized satellite is a link hash key. Thus, there is no need to include a load date timestamp into the primary key check. For a non-historized satellite, additionally make sure that it has a 1:1 relationship with the corresponding non-historized link. Record counts in both entities should match exactly.

Testing Other Data Vault Entities

There are other special entity types in Data Vault worth mentioning in regards to testing:

  • Reference hubs and reference satellites: Testing approaches are similar to standard hubs and satellites. The only difference is there are no hash keys and business keys are used directly.
  • Record source tracking satellites: A column representing a static source name is added to the primary key test.
  • PIT Table (Business Vault):
    • PK test – combination of the hub/link hash key and the snapshot date timestamp columns is unique
    • For every satellite reference, check that the pair of hub/link hash keys and the load date timestamp exists in the referenced satellite
    • Hub/link reference does not contain NULL or empty values
  • Bridge Table (Business Vault):
    • PK test – combination of a base link hash key and snapshot date timestamp columns is unique
    • For every hub and link reference, check that a pair of hub/link hash key exists in the referenced hub or link

General Tests for all Data Vault Entities

There are some tests applicable for all Data Vault entities.
Make sure that all Data Vault entities:

  • Contain zero keys instead of NULL keys
  • Have records source columns that are populated and correspond to the defined pattern (e.g., regex). For example, check if it contains the file path where the name of the top level folder represents the name of the source system and the file name includes the timestamp of the data extraction
  • Don’t have NULL values in their load (snapshot) date timestamp columns

Testing Source Marts

The Source Mart is one of the facets of the Information Mart concept in the Data Vault. It is a virtualized model on top of the Raw Data Vault with the aim of replicating the original source structures. It is great for ad-hoc reporting and offers higher value for many data scientists and power users and can also be used to test consistency and auditability of the loading process into a Data Vault-powered EDW.

Source mart objects are intended to look the same as the respective source tables (including columns names). If you have source marts implemented in your EDW, make sure to compare them against the respective source tables in the staging area after the data loading process. Values and row counts of source structures should match exactly against the respective source mart objects. In the Data Vault community, this kind of test is also known as a “Jedi-Test”.

It is relatively easy to automate such comparison and make it a part of the loading process.

Testing Hash Key and Hash Diff Calculations

Hash keys in Data Vault allows business keys to be integrated in a deterministic way from multiple sources in parallel. They are the glue that binds different Data Vault entities together.

Hash diffs, on the other hand, apply to the satellites and help identify differences in descriptive attributes during the data loading process.

It is important to introduce unit tests for hash key and hash diff calculations used in your EDW, to make sure the hashed values are calculated in accordance with the hashing standards defined. Read more about requirements and templates for hashing here. Test cases for such unit tests should cover as many combinations of different data types and values (e.g. NULL and empty values) as possible, to ensure that they are calculated consistently.

In case your EDW exists on different DBMS platforms (e.g. during migration process or data security regulations), the above test cases can be used to make sure that your hash calculations are platform agnostic, meaning that they produce the same result on different platforms. There is a common use case, when a link in an on-premise DBMS platform references a hub that was already migrated to a Cloud platform. Such unit tests can be run on both platforms to ensure consistency of hashing during a migration.

Testing Business Rules

Unlike the hard rules that do not alter or interrupt the contents of the data, maintaining auditability, soft or business rules enforce the business requirements that are stated by the business users. Examples of business rules can include:

  • Concatenation (last name and first name)
  • Standardizing phone numbers
  • Computing total sales (aggregation)
  • Coalescing, etc.

Apart from the relatively simple examples listed above, there might also be some more complex business rules involving sophisticated calculations, data transformations, and complex joins. Depending on the use case, the results of applying such rules usually end up in the Business Vault (i.e. a Business Satellite) and later in the Information Mart layer where they are consumed by the business users. Thus, testing business rules is an important part of the information delivery process.

Business rules are usually also a subject of unit testing that must be done continuously during the development and CI process. To perform such a unit test, we need some expected values, in the best case provided by the business, i.e., an expected net sales value for a defined product or a set of products in a specific shop on a named day based on the real data. The net sales calculation from our Business Vault is then tested against the given expected result.

Test Automation and Continuous Integration

All of the above described tests should be automated as much as possible and run by EDW developers during the development process. Successful tests should be an obligatory condition for introducing any new change to your EDW code base. That is achievable by using DevOps tools and enabling continuous integration (CI) in your DWH development lifecycle. Running automated tests each time code is checked or merged ensures that any data consistency issues or bugs are detected early and fixed before they are put into production. As a rule, a separate test (or CI) environment is created for the purpose of running automated tests.

Here are some general recommendations for creating and running a test environment:

  • Create the CI environment as similar as possible to the production environment
  • Create test source databases and source files derived from real data
  • The test source files and source databases should be small so tests can run quickly
  • The test source files and source databases should also be static so that the expected results are known in advance
  • Test full load and incremental load patterns since the logic of both patterns is different in most of the cases
  • Run tests not only against the changes to be merged but also against all the downstream dependencies, or even the whole loading process in general to prevent regressions.

Conclusion

In this newsletter, we provided an overview of different methods and approaches for the process of technical testing a Data Vault powered EDW.

We covered testing of different stages of the EDW load including extraction of the data from data sources, loading Data Vault entities, and information delivery process, though primary focus was placed upon loading Data Vault entities.

We also covered unit testing hash key & hash diff calculations.

It is important to make sure that your hashing solution is platform/tool agnostic, especially during the migration process.

We also learned that testing business rules is a key part of the information delivery process since they interpret the data and define what business users see in their reports. We highlighted the importance of unit testing the business rules and cooperation with the business in respect to defining test cases and expected results.

Furthermore, we also stressed the significance of test automation during the development phase as well as for enabling continuous integration and provided recommendations for creating and running a test environment.

We go even deeper into this topic in our webinar. Make sure to watch the recording for free!

Close Menu