
A semantic layer gives every dashboard, analyst and AI agent one governed definition of each business metric, and it is fast becoming the guardrail that makes agentic AI on enterprise data reliable. That was the core message of a Scalefree webinar held on 22 September 2026. The talk was deliberately tool-agnostic: products appear only as examples, so the ideas apply whatever stack you run.
Demystifying the Semantic Layer
Semantic Layer, Context Layer, Metrics Mart, Ontologies… it’s getting really hard to understand what these terms mean and how to get the most out of them in your implementation. In this webinar, we will clear up the confusion around the Semantic Layer once and for all, providing clear examples of how modern data platform projects implement it to enable self-service BI, unlock the potential of agentic automation, and more.
The problem: everyone has their own version of the truth
When business users consume warehouse data however they like and define their own metrics, the result is a so-called “spaghetti pipeline”. Two teams ask the same question, such as “what was revenue last quarter?”, and get different numbers.
This is not only an analytics headache. With no clear ownership of where metrics are defined, the business keeps coming back to the data team to reconcile conflicting results. This is known as metric drift. It is also a data architecture problem: the platform must be able to govern business definitions, glossary terms and KPIs as it scales.
The long-standing answer is a semantic layer: a central layer on top of the data platform that hides the complexity of warehouse schemas and maps them to the business definitions people actually need.
What a semantic layer is
Because most definitions online come from vendors and mirror their products, the webinar offered a vendor-neutral one:
”A semantic layer is a metadata-driven, business-oriented abstraction layer that maps the underlying data structures to business terms and metrics, providing a governed, single source of truth that facilitates scalable self-service and automation.
Each part of that sentence carries weight:
- Metadata-driven. The layer stores no rows. It holds configuration, calculation logic and relational rules, usually as code in YAML, JSON or SQL.
- Business-oriented. It speaks the domain’s language (revenue, active subscribers) rather than the database’s, and leaves storage and compute optimisation to other layers.
- Abstraction layer. It decouples physical storage from consumption tools, so engineers can refactor schemas or swap infrastructure with minimal downstream impact.
- Governed single source of truth. Every query passes through one choke point, so a metric is calculated the same way whichever tool asks, and access policies are defined once and enforced everywhere.
- Scalable self-service and automation. Business users can build reports without SQL, and AI agents can query data in a governed way.
Not a new idea
Semantic layers date back decades. The webinar traced four eras:
- 1990s: Business Objects formalises the “universe” concept, translating relational schemas into business terms. The approach was early and tied to one tool.
- 2000s: Enterprise BI platforms such as Cognos and MicroStrategy centralise metric definitions, but the logic stays locked inside proprietary systems.
- 2010s: Semantics become code, with version-controlled definitions such as Looker’s LookML. They are still tied to a single vendor.
- 2020s: Headless, API-first layers such as dbt MetricFlow and Cube serve one set of definitions to many tools. This is the current state of the art.
The headless shift is the most significant: one set of definitions can now feed Power BI, Tableau, Looker Studio, notebooks and AI agents alike, and open standards are emerging too.
Where it sits in the architecture
In a typical platform, source systems (tier 1) are loaded into a cloud warehouse such as Redshift, BigQuery, Snowflake or Databricks (tier 2), where data is modelled up to a gold or consumption layer. The semantic layer (tier 3) sits on top of those physical schemas as a unified business context. Consumers (tier 4), whether BI dashboards, Python notebooks or LLM-powered agents, query it through uniform APIs.
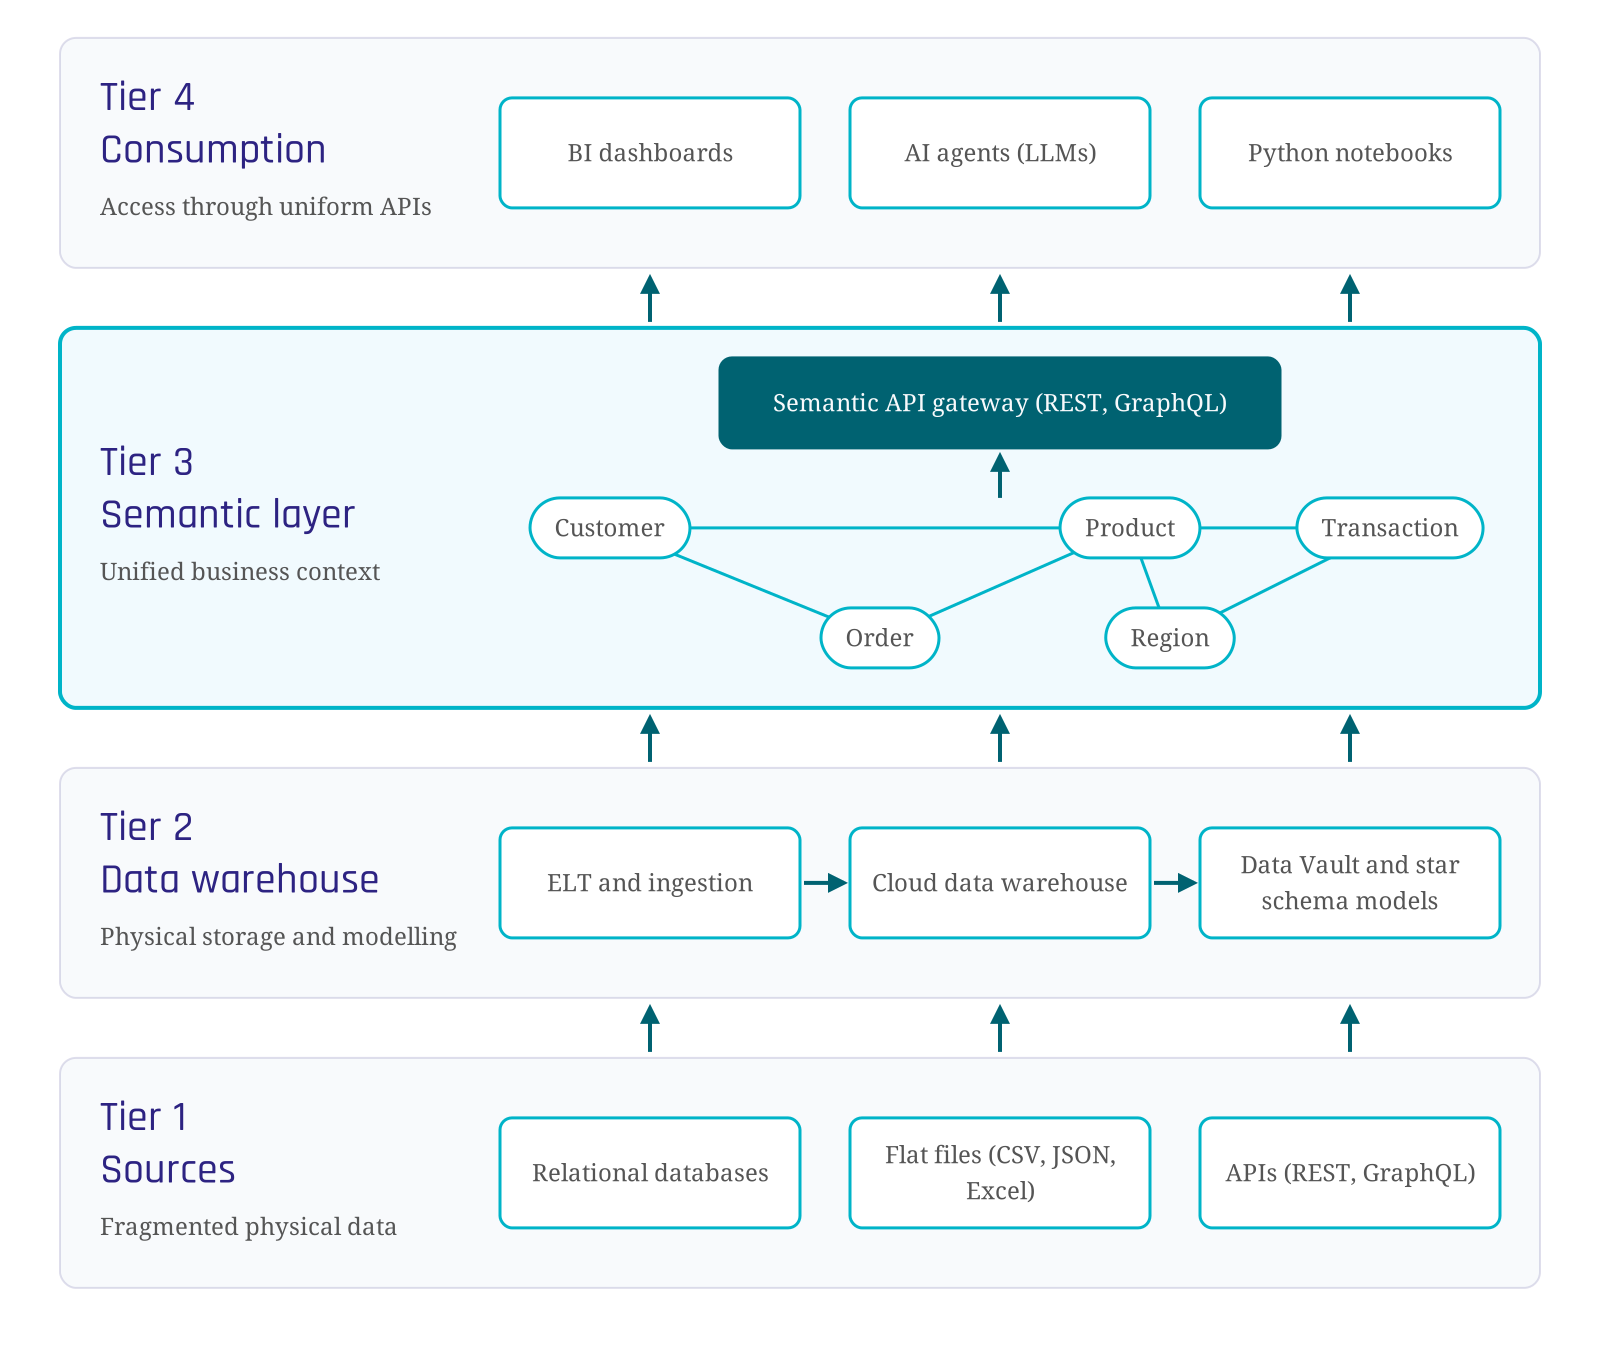
The four tiers of a data platform, with the semantic layer between the warehouse and its consumers.
Anatomy of a semantic model
Tool terminology varies, but most semantic layers share five building blocks:
- Entities map business concepts to underlying tables. Data Vault practitioners will recognise the parallel with hubs.
- Dimensions are the qualitative attributes, such as dates or categories, used to slice, filter and group entities, much as in dimensional modelling.
- Measures and metrics carry the business logic. Measures are quantitative building blocks (aggregations); metrics are the finished calculations, effectively KPIs such as total revenue.
- Relationships define how tables connect, so that consumers do not invent joins.
- Governance, where the tool supports it, centralises access control and the handling of personal data.
A minimal example
To stay vendor-neutral, the webinar illustrated these blocks with the Open Semantic Interchange (OSI), an open standard for declaring semantic models in YAML. The slide’s model, reconstructed from the recording, looks like this:
– name: ecommerce_analytics
description: Core e-commerce analytics model for the enterprise
datasets:
– name: orders
source: sales.public.orders
primary_key: [order_id] fields:
– name: customer_id
expression:
– dialect: ANSI_SQL
expression: customer_id
– name: customers
source: sales.public.customers
primary_key: [id] relationships:
– name: orders_to_customers
from: orders
to: customers
from_columns: [customer_id] to_columns: [id] metrics:
– name: total_revenue
description: Total revenue across all orders
expression:
– dialect: ANSI_SQL
expression: SUM(orders.amount)
Datasets are the entities, the relationship tells any consumer how orders join to customers (preventing “explosive” fan-out joins by an agent), and the metric defines total revenue once. Declaring the SQL dialect lets engines generate queries suited to each database. A real model would hold dozens of datasets.

The Data Vault Handbook:
Core Concepts and Modern Applications
Build Your Path to a Scalable and Resilient Data Platform
The Data Vault Handbook is an accessible introduction to Data Vault. Designed for data practitioners, this guide provides a clear and cohesive overview of Data Vault principles.
How it works
Every request starts with semantic graph traversal. When a dashboard or an AI agent asks for a metric, the engine treats datasets as nodes and relationships as edges, then finds the relational path needed to stitch the data together. Nobody writes the joins by hand; the SQL is generated.
Once the path is known, the layer has to execute it. The industry uses two paradigms:
SQL pushdown (compute at rest). The layer stores nothing and acts as a compiler. It turns each request into SQL optimised for the target warehouse’s dialect and pushes the compute down to it. Queries return in seconds. dbt MetricFlow is an example.
Pre-aggregation (compute in memory). A standalone service builds in-memory views between the warehouse and the applications and serves queries from that cache. It delivers sub-second responses and suits high-concurrency workloads, such as many agents querying at once. Cube is an example.
With pushdown, the same question always compiles to the same SQL. This consistency is what lets many people, or many agents, ask for the same metric at different times and get one version of the truth.
Operating it: the push/pull governance model
If every new metric needs an IT ticket, the semantic layer becomes a bottleneck. The webinar proposed a three-step collaborative model:
- Push (centralised). The core data engineering team defines standards and governance patterns and owns the certified, company-wide tier-one metrics.
- Pull (self-service). Business units treat the semantic layer as code: they branch the repository and define their own departmental metrics, with transparency and ownership.
- Automated promotion. When a local metric proves valuable company-wide, CI/CD pipelines test it (configuration, join and metric-parity checks, guarding against fan-out paths and broken references) and promote it to the central layer.
The webinar was also critical of a rigid “one source of truth”. If only the central team can define truth, the company stalls. Business users know the business best; engineers know governance and standards. The push/pull loop is meant to get the best of both.
Why agentic AI needs a semantic layer
LLMs are probabilistic: they predict the most likely next token from their training data and context, and they were not built to be reliable. Company KPIs must be deterministic, meaning the same question always gets the same answer. Point an agent straight at a warehouse and you are guaranteed different numbers for the same question.
The webinar named two risks for production deployments:
- Ambiguity. Table and schema names rarely tell an agent what to query for “what was revenue last month?”. It needs certified golden records, and the semantic layer is where those are declared.
- Confident hallucination. If the agent cannot reach the revenue table, it may invent an answer rather than admit it lacks access. Users who see three wrong answers stop trusting the tool.
A semantic layer changes the failure mode. The LLM maps intent to predefined metrics; if a request falls outside the modelled scope, the layer rejects it with a clear error instead of a silent hallucination. The webinar cited an April 2026 dbt Labs benchmark on the ACME Insurance dataset, in which agents grounded in a semantic layer reached 98.2% task accuracy with Claude Sonnet 4.6 (8.2 points above raw text-to-SQL) and 100% with GPT-5.3-Codex (15.9 points above). dbt Labs used its own tool in the study, though other published benchmarks reportedly point the same way.
The layer also acts as a governance enforcement point. Policies written once in YAML propagate to Tableau, notebooks and agents alike. Row-level security filters data at compile time by role or region, and the recommendation is to treat an AI agent like any other user: no agent should see all the data. This removes the need to reimplement security inside each BI tool or LLM wrapper.
RAG and the semantic layer are complements
Retrieval-augmented generation is a probabilistic retrieval framework built for unstructured text, ideal for questions like “what does this contract say about early termination?”. It is unsuitable for exact numbers. The semantic layer is a deterministic, compile-first engine for structured data and reproducible calculations, such as net revenue in EMEA last quarter. The pattern described for 2026: RAG as the retrieval tier for qualitative context, the semantic layer as the deterministic harness that turns it into governed SQL.
The Data Vault Handbook:
Core Concepts and Modern Applications
Build Your Path to a Scalable and Resilient Data Platform
The Data Vault Handbook is an accessible introduction to Data Vault. Designed for data practitioners, this guide provides a clear and cohesive overview of Data Vault principles.
Key takeaways
The webinar closed with three benefits:
- Decoupled complexity. Business logic moves into one version-controlled place, separate from physical data complexity.
- Resilient infrastructure. Engineers can change schemas and backends without breaking reports or APIs.
- AI readiness. Deterministic guardrails keep agents and analysts working from one governed definition of reality.