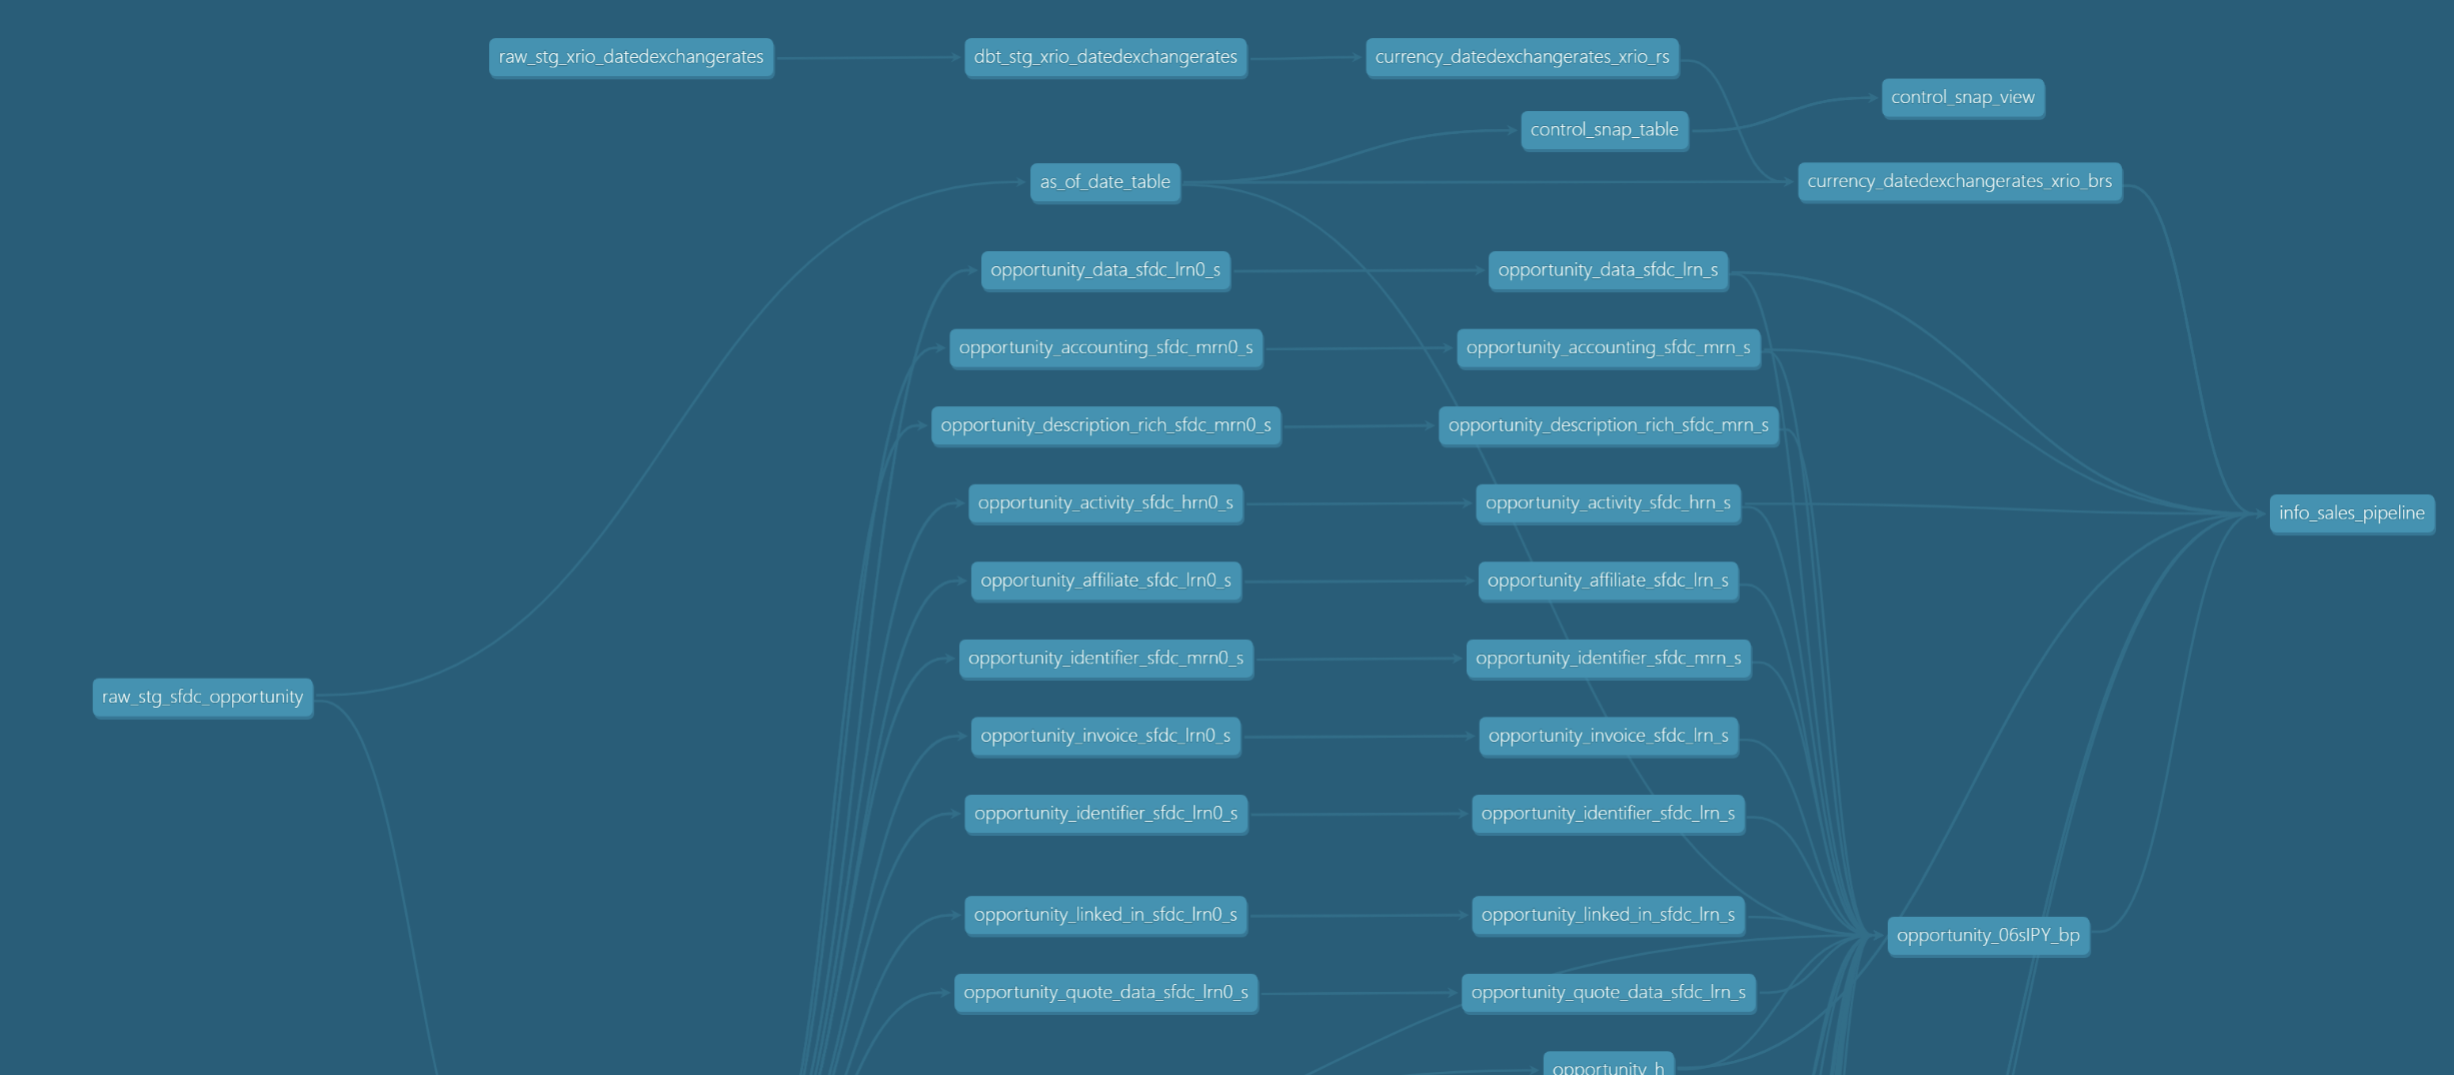
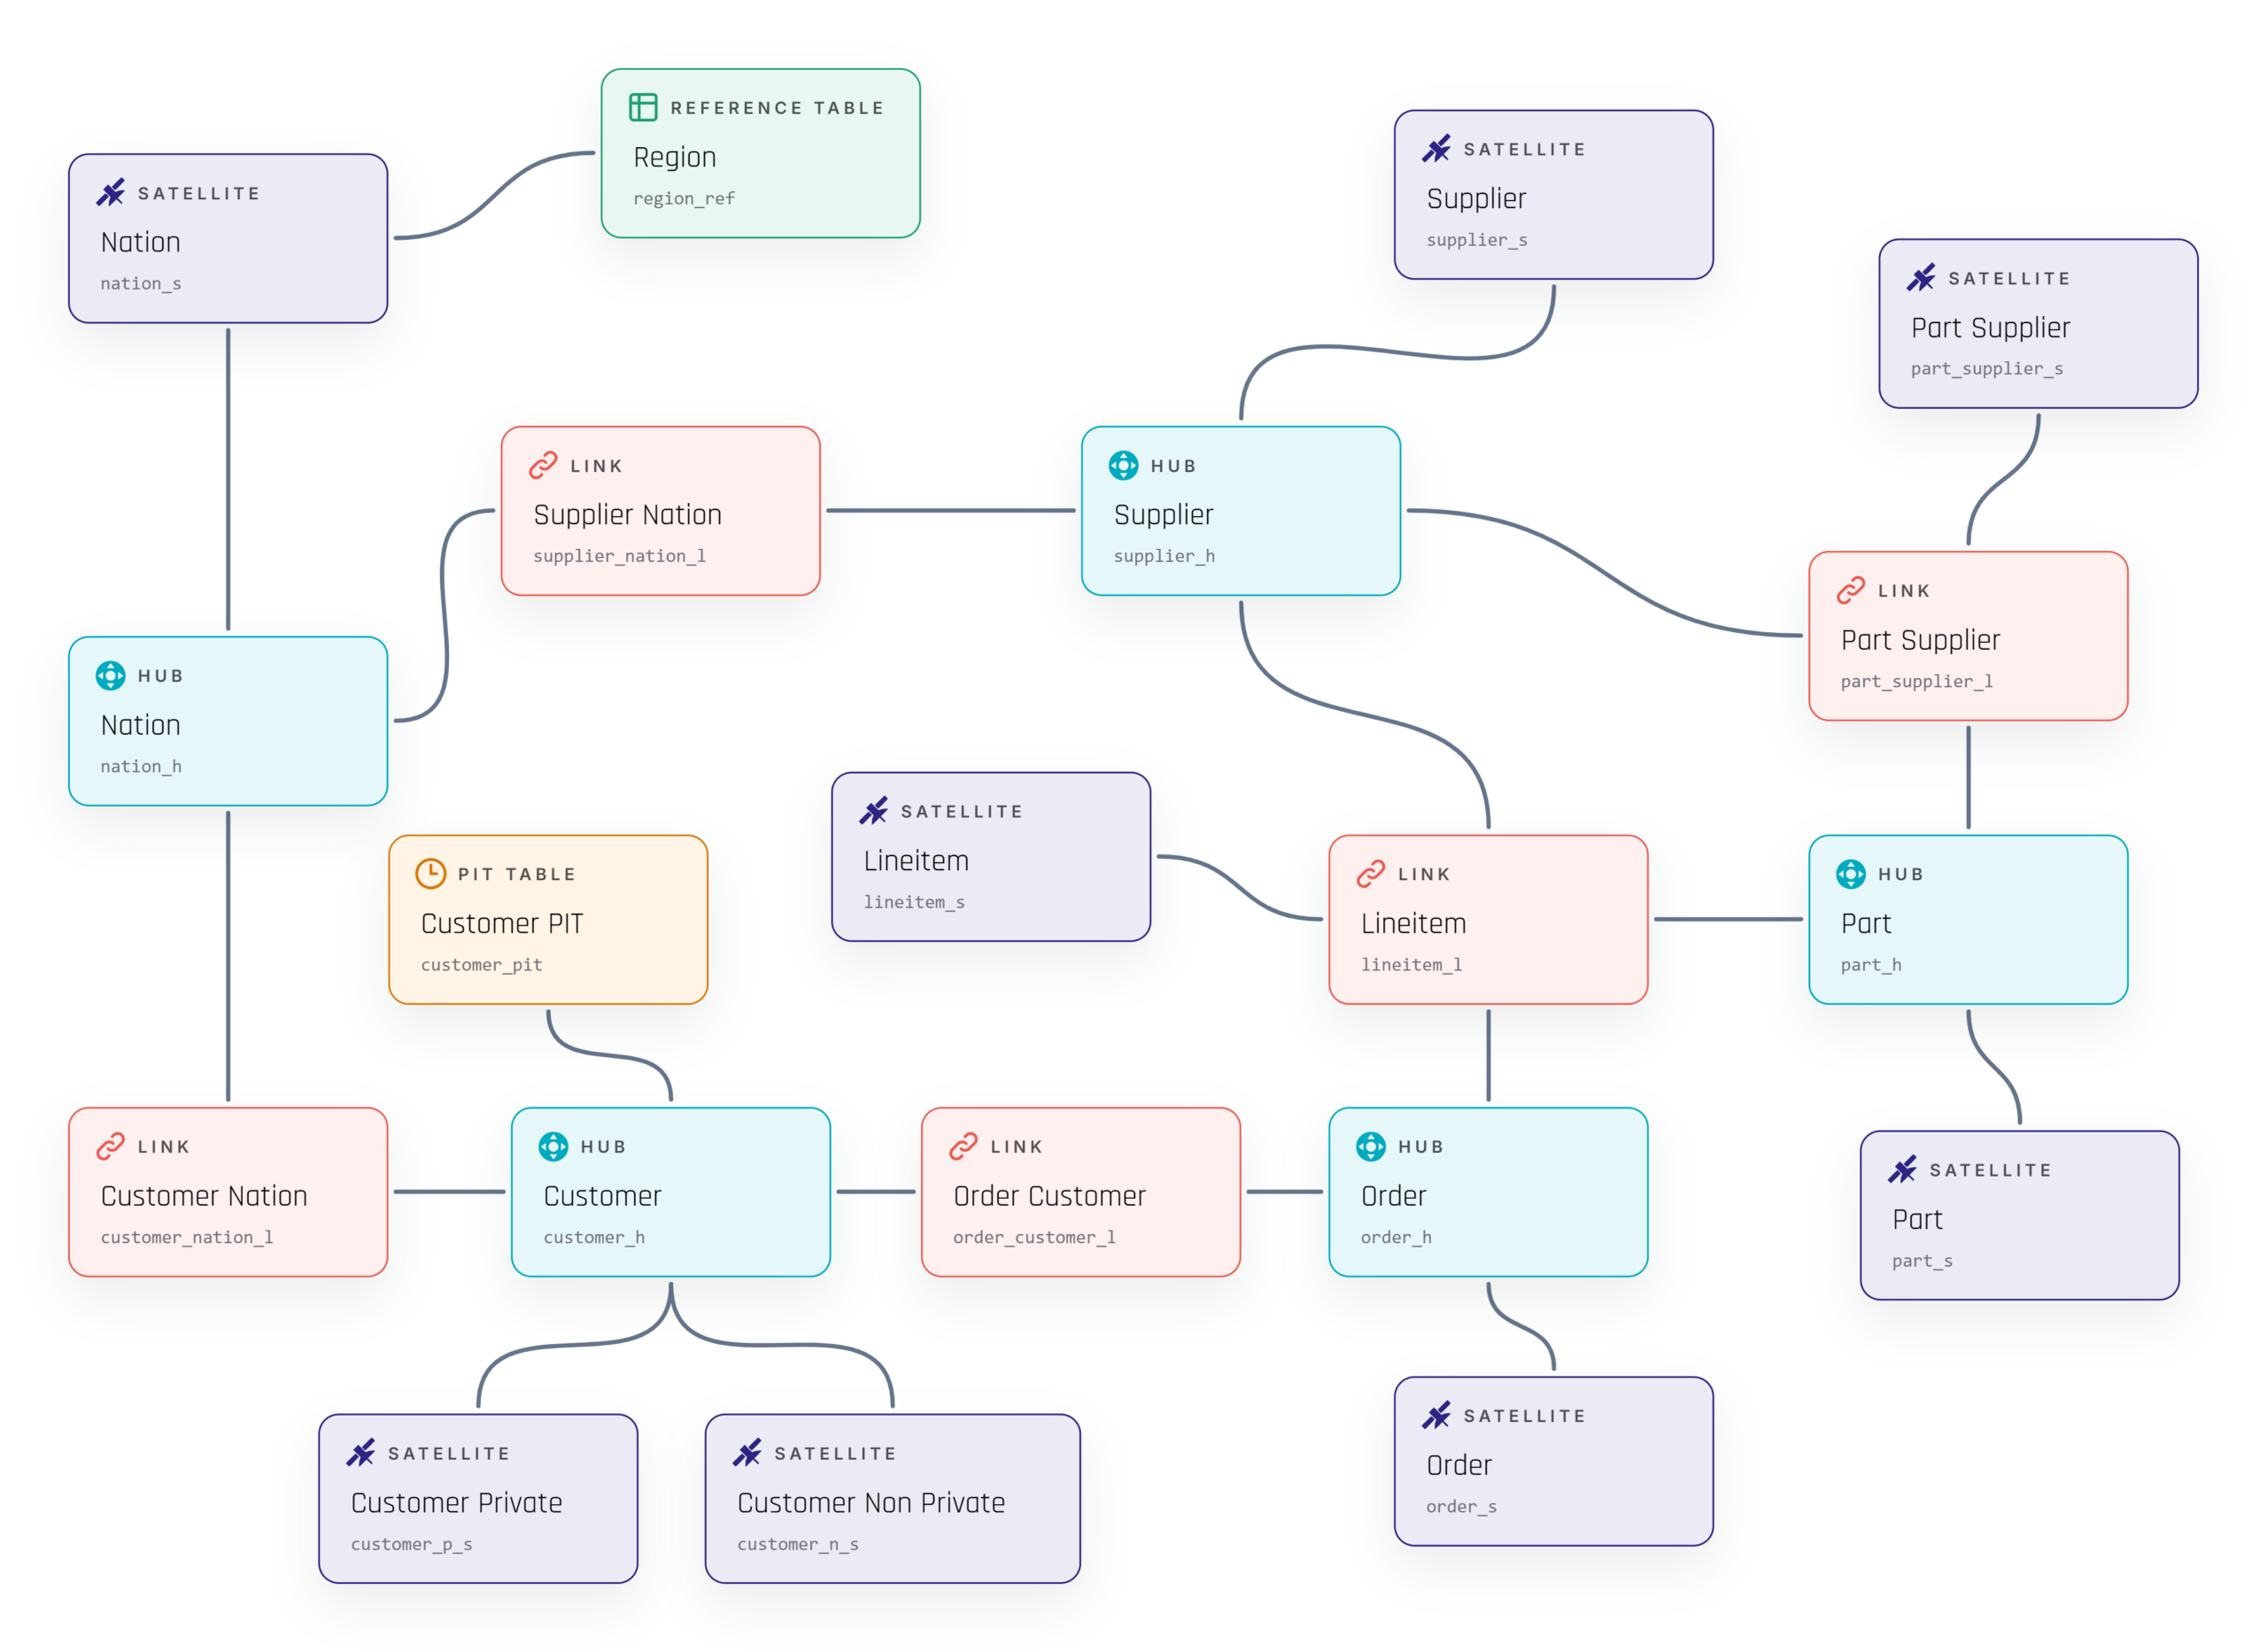
Anyone who has worked on a Data Vault project knows how important a good diagram can be. Hubs, Links, Satellites, and supporting structures show which business concepts matter, how they relate to one another, and where their descriptive history belongs. A clear model can turn a complex discussion into something everyone in the room can follow.
Creating that model is often more difficult than it needs to be. General-purpose diagramming tools can draw the shapes, but they do not understand Data Vault. Colors have to be selected by hand, naming conventions must be remembered, and technical details often end up as free text inside a box. Before long, more time is spent maintaining the diagram than discussing the model itself.
This is the problem we want to solve with Visual Data Vault.
Built by Scalefree, Visual Data Vault is a lightweight, browser-based application for visually designing and documenting Data Vault models. It provides a focused workspace with familiar Data Vault entity types, practical modeling details, and simple ways to save and exchange diagrams. It is also completely free to use, so you can open the editor and start modeling without purchasing a license or subscription.
It also has a deliberately clear scope. Visual Data Vault is a visual modeling tool. It helps you design, discuss, and communicate a Data Vault model, but it does not generate transformation code, deploy database objects, run data pipelines, or build the warehouse on your data platform.
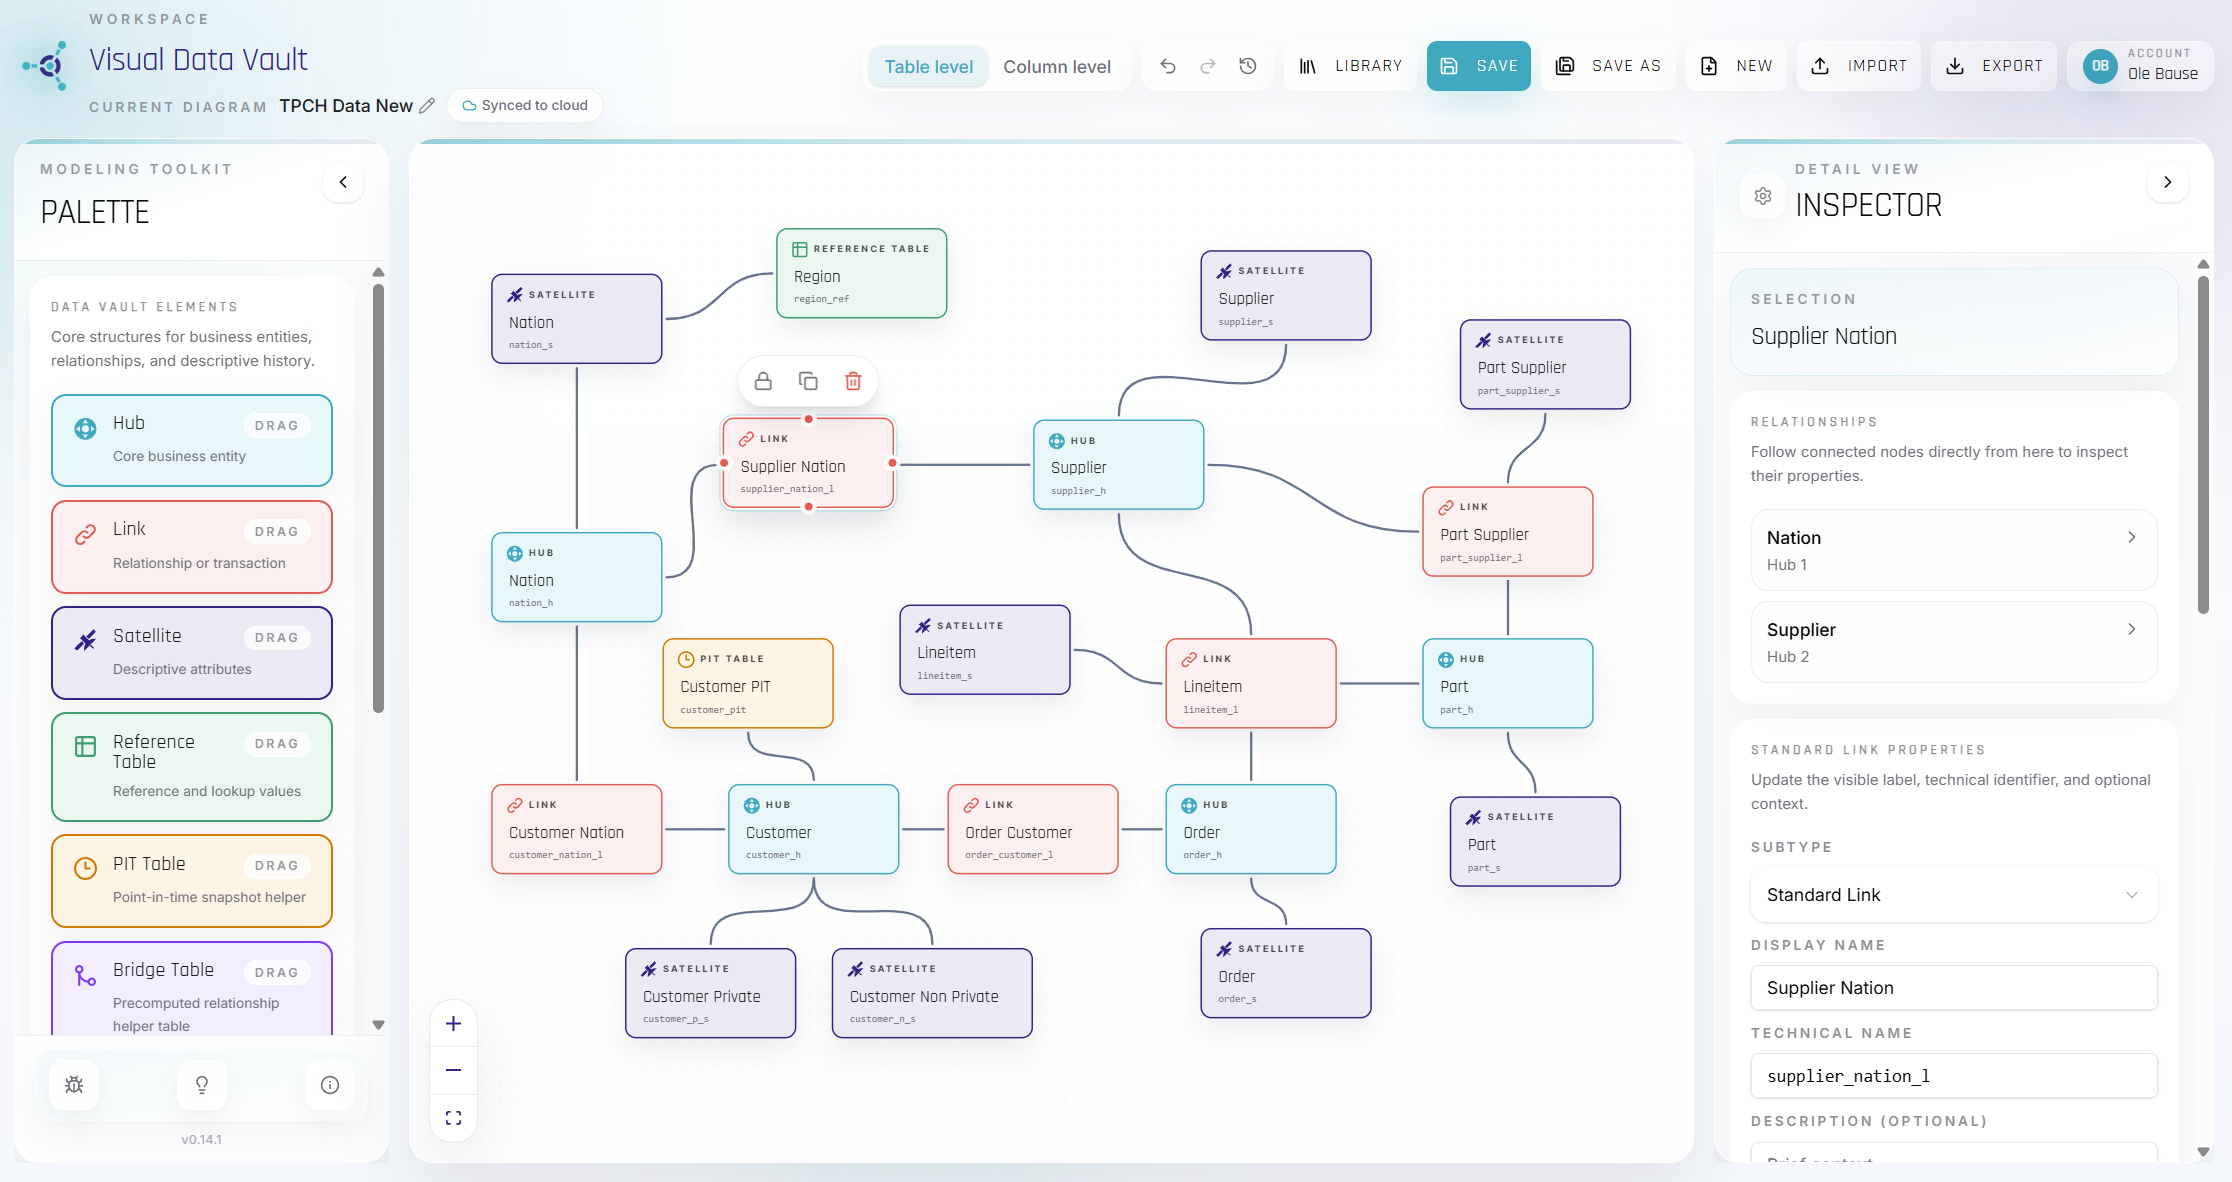
A Data Vault model created in a browser with purpose-built entity types and modeling controls.
Model with Data Vault entity types
When you open the editor, you do not start with a collection of generic shapes. The palette contains the Data Vault entities you need, ready to place on the canvas: Hubs, Links, Satellites, Reference Tables, PIT Tables, and Bridge Tables.
More specialized entity types are available as well. You can model Reference Hubs; Non-Historized and Hierarchical Links; and Reference, Multi-Active, Effectivity, Record-Tracking, and Non-Historized Satellites. Each one is visually recognizable, while the diagram as a whole keeps a consistent look.
Of course, real-world diagrams often need some extra context. A source table may need to appear next to the Raw Vault model, a design decision may need a short explanation, or a large subject area may need a visible boundary. For these situations, the editor also includes generic tables, notes, and groups.
The basic workflow feels natural: drag an entity onto the canvas, name it, move it into place, and connect it. From there, alignment assistance and multi-selection help keep the layout tidy. You can copy and paste parts of a model, lock finished entities in place, adjust relationship paths, and use undo or redo while trying out a different design. Local change history gives you another way to return to an earlier point.
The result is an editor that stays out of the way and lets the conversation remain focused on the model.

Entities can be placed and connected without manually recreating Data Vault notation.
Add the detail that makes a model useful
A good Data Vault diagram needs more than correctly colored entities. It should also carry enough information to support the next design discussion.
In Visual Data Vault, each entity can have a readable display name as well as a unique technical table name. Technical names can be created automatically from configurable naming conventions. When a model grows or changes, this helps keep names consistent without turning every edit into a manual cleanup task.
Select an entity and its details appear in the inspector beside the canvas. Depending on the entity type, you can define business or reference keys, review standard technical columns, and add descriptive columns with their data types. Relationships can also have labels and descriptions, making their meaning easier to understand when the diagram is shared with someone else.
Sometimes you want to discuss the architecture without seeing every column. At other times, those columns are exactly what the discussion is about. Visual Data Vault supports both situations through table-level and column-level views. The compact table-level view is well suited to workshops and high-level reviews. Switch to the column-level view when you need to look more closely at keys, metadata, and structure.
The editor also provides basic guidance when entities are connected. Clearly invalid relationships are prevented, which helps catch simple modeling mistakes as they happen. This guidance is there to support the modeler, not to replace architectural judgment or act as a complete validation framework.
Switch from an architectural overview to column-level detail without leaving the canvas and edit column names
Save your work and export it in the format you need
Many models are not finished in a single session. They develop over several workshops, review rounds, and small improvements. Visual Data Vault lets you save diagrams to your account and return to them through the diagram library.
The library makes it easy to find, rename, clone, reopen, or remove a saved diagram. Autosave helps protect changes while you work, so the editor can be used for an evolving design rather than only for a quick sketch.
Of course, a diagram rarely stays inside one application. It may need to become part of a presentation, a technical specification, or another modeling workflow. Visual Data Vault therefore includes four export options, each intended for a different purpose:
- PNG creates a high-resolution image that can be added directly to presentations, documents, and architecture specifications.
- PDF captures the diagram as a single-page document that is easy to review, distribute, or archive.
- JSON preserves the Visual Data Vault diagram in an editable application format. It is the best option for backing up a model or moving it between Visual Data Vault sessions.
- DBML exports supported tables and relationships for use in compatible external modeling tools.
JSON and DBML can also be imported, making it possible to bring an exported diagram back onto the canvas or use supported DBML structures as the starting point for a new visual model. These import and export features are available as part of the free application.
Before an imported JSON or DBML file replaces the current canvas, the application validates it and shows what can be brought into the model. For DBML, it can report incomplete or unsupported elements and offer repair options for some missing metadata.
There is one important limitation to keep in mind: DBML is an exchange format, not a complete description of Data Vault semantics. It can transfer supported tables and relationships, but it does not preserve every modeling rule, key, constraint, or implementation choice.
Continue saved models later or export them as image, document, JSON, and DBML formats.
A visual modeling tool with a clear scope
Visual Data Vault fits into the part of a project where a model needs to become visible, understandable, and ready for discussion. You might use it to sketch the first version of a Raw Vault, work through relationships during a workshop, prepare for an architecture review, or create a consistent diagram for technical documentation.
Once the visual model is agreed upon, the engineering work still remains. Your chosen implementation and automation tools are responsible for creating tables, building loading patterns, transforming data, testing pipelines, and deploying the solution to the target platform. Visual Data Vault complements those tools; it does not try to replace them.
The same clear boundary applies elsewhere. Visual Data Vault is not a full metadata or lineage platform, and it is not currently a real-time multi-user modeling environment. Its purpose is more direct: make Data Vault diagrams easier to create, enrich, maintain, and exchange.
We believe that focus is useful. Data Vault practitioners should not have to rebuild their modeling language from generic shapes every time they start a diagram. They should be able to open a canvas that already understands the work they want to do.
Create your first model
Visual Data Vault brings Data Vault entity types, technical modeling detail, diagram management, and useful export formats into one browser-based workspace, and it is completely free to use.
Open Visual Data Vault and create your first diagram at no cost. The next time your team discusses a Data Vault design, you will have a clear model everyone can see, review, and understand.