search
0

Introducing Visual Data Vault: A Purpose-Built Canvas for Data Vault Modeling

Visual Data Vault Example

Anyone who has worked on a Data Vault project knows how important a good diagram can be. Hubs, Links, Satellites, and supporting structures show which business concepts matter, how they relate to one another, and where their descriptive history belongs. A clear model can turn a complex discussion into something everyone in the room can follow.

Creating that model is often more difficult than it needs to be. General-purpose diagramming tools can draw the shapes, but they do not understand Data Vault. Colors have to be selected by hand, naming conventions must be remembered, and technical details often end up as free text inside a box. Before long, more time is spent maintaining the diagram than discussing the model itself.

This is the problem we want to solve with Visual Data Vault.

Built by Scalefree, Visual Data Vault is a lightweight, browser-based application for visually designing and documenting Data Vault models. It provides a focused workspace with familiar Data Vault entity types, practical modeling details, and simple ways to save and exchange diagrams. It is also completely free to use, so you can open the editor and start modeling without purchasing a license or subscription.

It also has a deliberately clear scope. Visual Data Vault is a visual modeling tool. It helps you design, discuss, and communicate a Data Vault model, but it does not generate transformation code, deploy database objects, run data pipelines, or build the warehouse on your data platform.

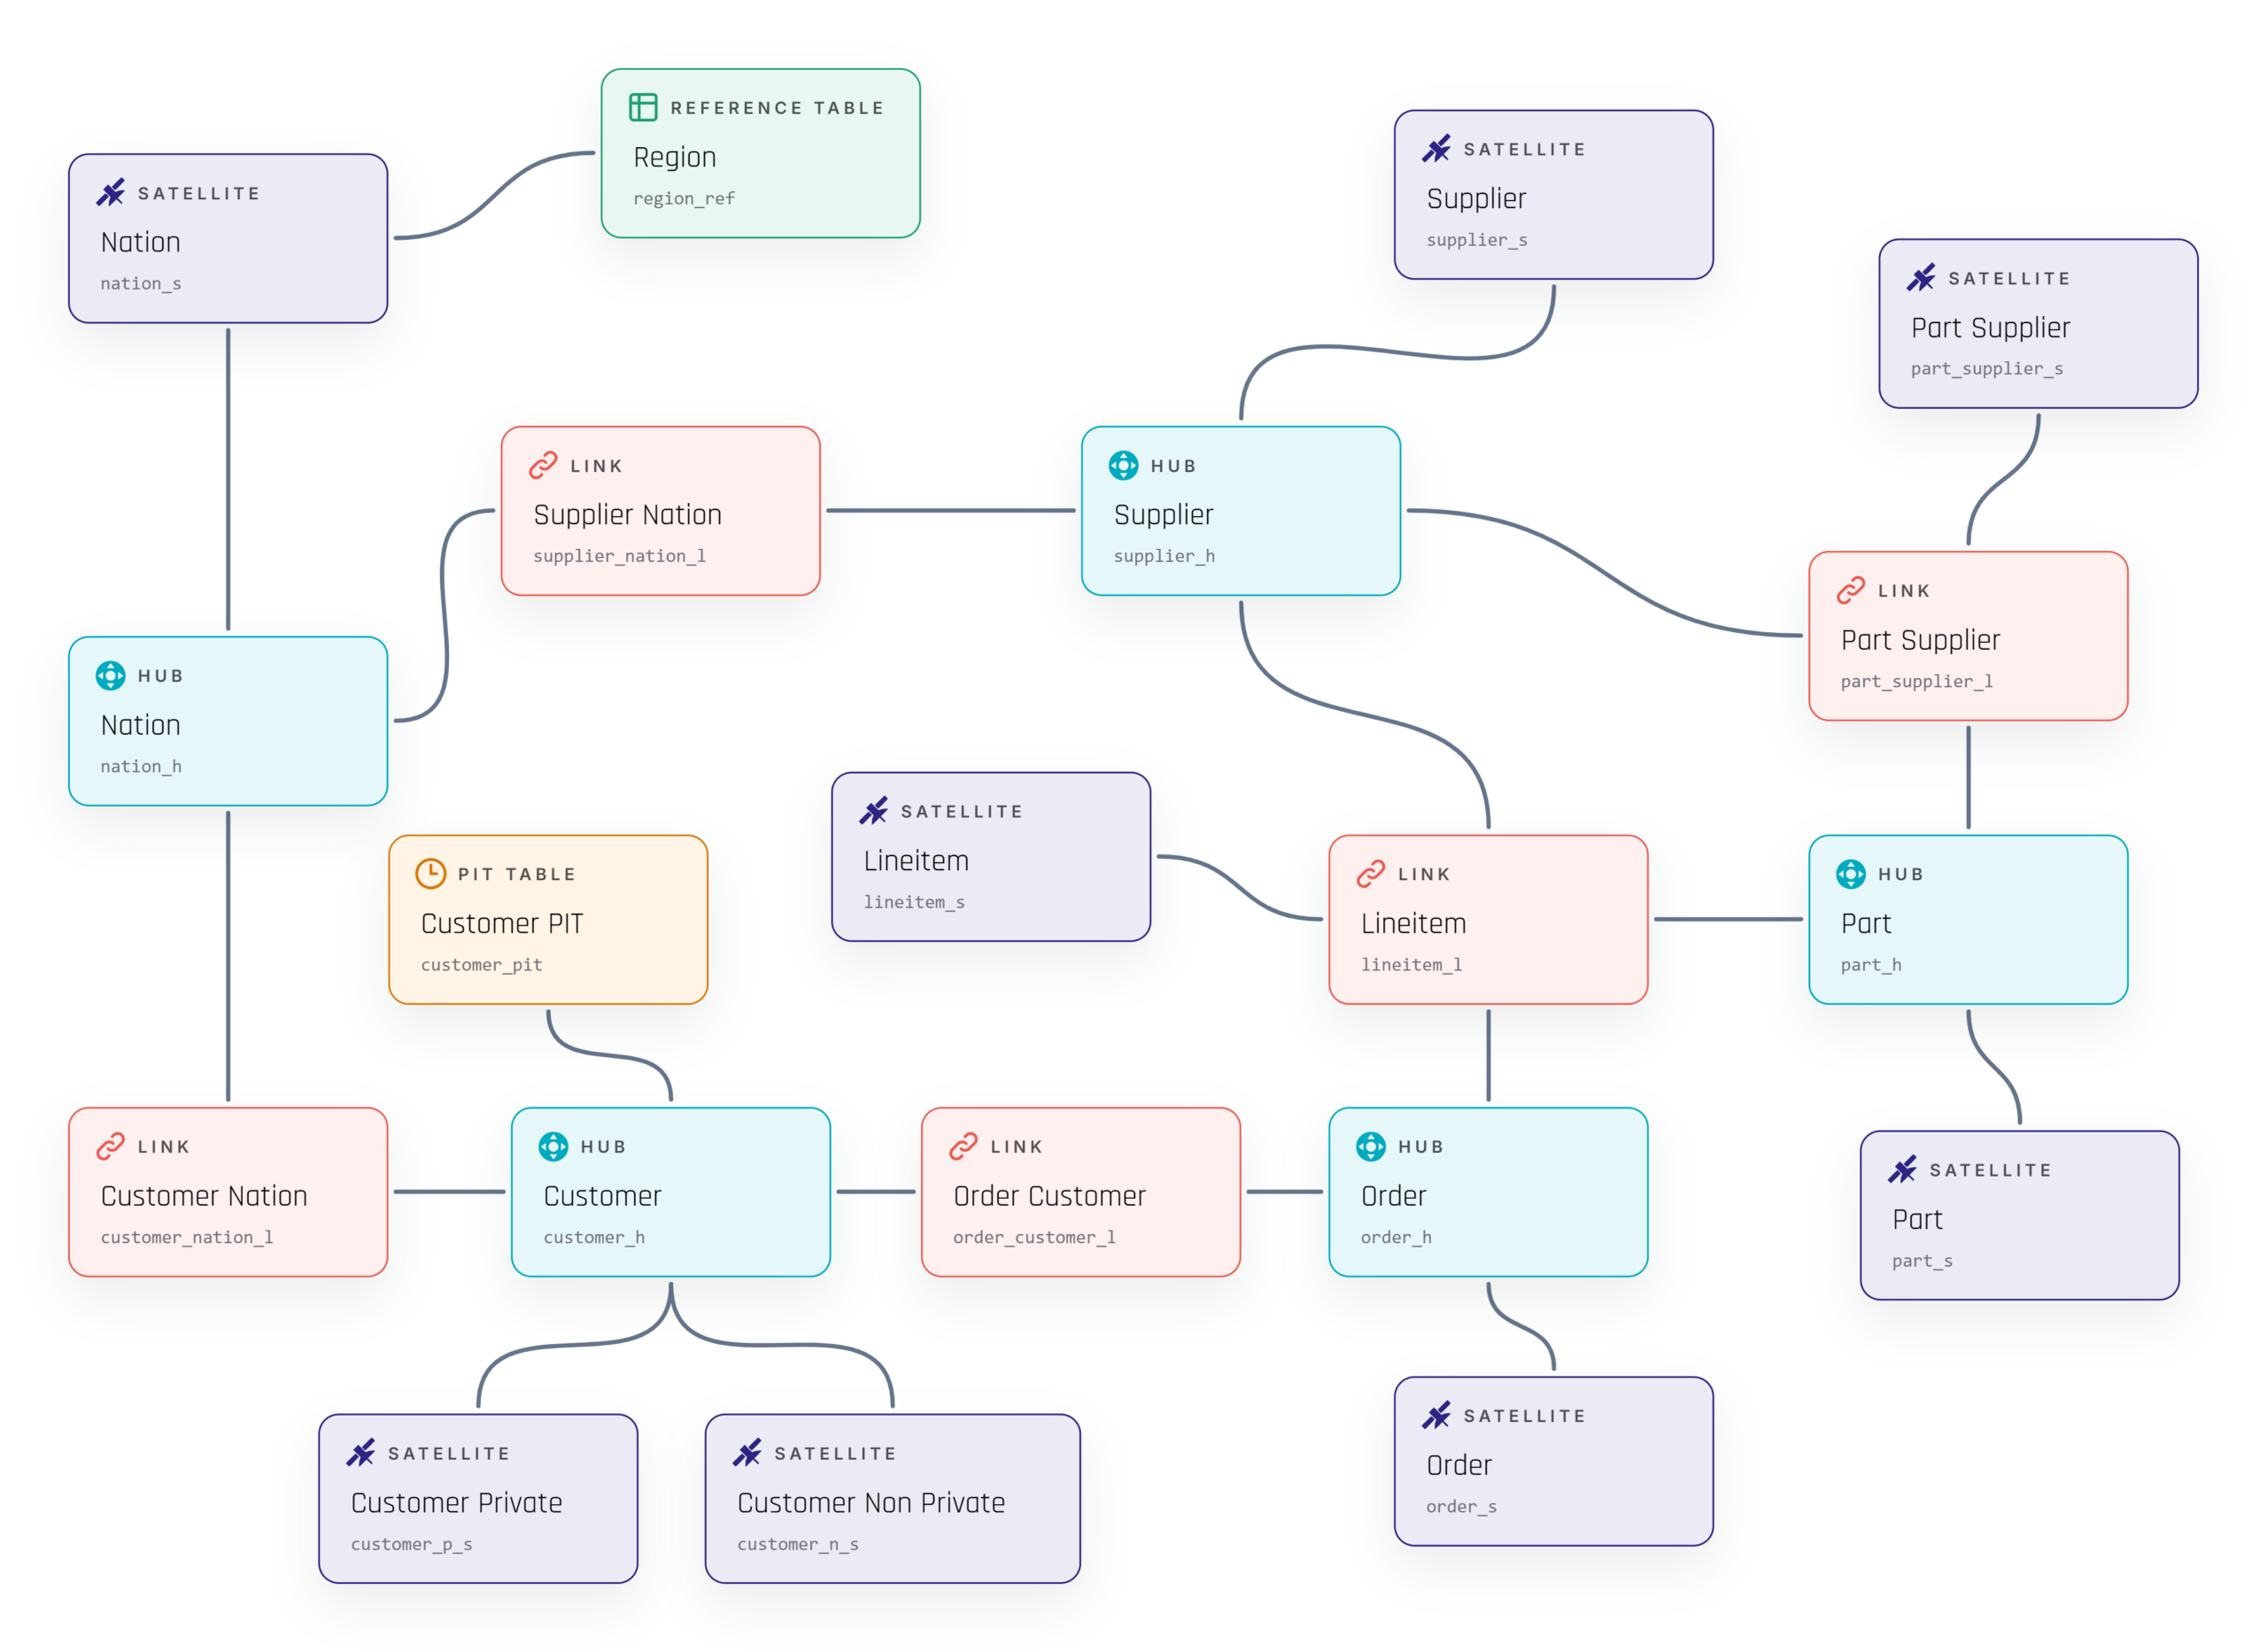
Diagram of a Data Vault model on a UI canvas, showing hubs, links, and satellites (Nation, Region, Supplier, Customer, Order, Part) connected in a network.

A Data Vault model created in a browser with purpose-built entity types and modeling controls.

Model with Data Vault entity types

When you open the editor, you do not start with a collection of generic shapes. The palette contains the Data Vault entities you need, ready to place on the canvas: Hubs, Links, Satellites, Reference Tables, PIT Tables, and Bridge Tables.

More specialized entity types are available as well. You can model Reference Hubs; Non-Historized and Hierarchical Links; and Reference, Multi-Active, Effectivity, Record-Tracking, and Non-Historized Satellites. Each one is visually recognizable, while the diagram as a whole keeps a consistent look.

Of course, real-world diagrams often need some extra context. A source table may need to appear next to the Raw Vault model, a design decision may need a short explanation, or a large subject area may need a visible boundary. For these situations, the editor also includes generic tables, notes, and groups.

The basic workflow feels natural: drag an entity onto the canvas, name it, move it into place, and connect it. From there, alignment assistance and multi-selection help keep the layout tidy. You can copy and paste parts of a model, lock finished entities in place, adjust relationship paths, and use undo or redo while trying out a different design. Local change history gives you another way to return to an earlier point.

The result is an editor that stays out of the way and lets the conversation remain focused on the model.

Visual Data Vault

Entities can be placed and connected without manually recreating Data Vault notation.

Add the detail that makes a model useful

A good Data Vault diagram needs more than correctly colored entities. It should also carry enough information to support the next design discussion.

In Visual Data Vault, each entity can have a readable display name as well as a unique technical table name. Technical names can be created automatically from configurable naming conventions. When a model grows or changes, this helps keep names consistent without turning every edit into a manual cleanup task.

Select an entity and its details appear in the inspector beside the canvas. Depending on the entity type, you can define business or reference keys, review standard technical columns, and add descriptive columns with their data types. Relationships can also have labels and descriptions, making their meaning easier to understand when the diagram is shared with someone else.

Sometimes you want to discuss the architecture without seeing every column. At other times, those columns are exactly what the discussion is about. Visual Data Vault supports both situations through table-level and column-level views. The compact table-level view is well suited to workshops and high-level reviews. Switch to the column-level view when you need to look more closely at keys, metadata, and structure.

The editor also provides basic guidance when entities are connected. Clearly invalid relationships are prevented, which helps catch simple modeling mistakes as they happen. This guidance is there to support the modeler, not to replace architectural judgment or act as a complete validation framework.

blank

Switch from an architectural overview to column-level detail without leaving the canvas and edit column names

Save your work and export it in the format you need

Many models are not finished in a single session. They develop over several workshops, review rounds, and small improvements. Visual Data Vault lets you save diagrams to your account and return to them through the diagram library.

The library makes it easy to find, rename, clone, reopen, or remove a saved diagram. Autosave helps protect changes while you work, so the editor can be used for an evolving design rather than only for a quick sketch.

Of course, a diagram rarely stays inside one application. It may need to become part of a presentation, a technical specification, or another modeling workflow. Visual Data Vault therefore includes four export options, each intended for a different purpose:

  • PNG creates a high-resolution image that can be added directly to presentations, documents, and architecture specifications.
  • PDF captures the diagram as a single-page document that is easy to review, distribute, or archive.
  • JSON preserves the Visual Data Vault diagram in an editable application format. It is the best option for backing up a model or moving it between Visual Data Vault sessions.
  • DBML exports supported tables and relationships for use in compatible external modeling tools.

JSON and DBML can also be imported, making it possible to bring an exported diagram back onto the canvas or use supported DBML structures as the starting point for a new visual model. These import and export features are available as part of the free application.

Before an imported JSON or DBML file replaces the current canvas, the application validates it and shows what can be brought into the model. For DBML, it can report incomplete or unsupported elements and offer repair options for some missing metadata.

There is one important limitation to keep in mind: DBML is an exchange format, not a complete description of Data Vault semantics. It can transfer supported tables and relationships, but it does not preserve every modeling rule, key, constraint, or implementation choice.

Visual Data Vault

Continue saved models later or export them as image, document, JSON, and DBML formats.

A visual modeling tool with a clear scope

Visual Data Vault fits into the part of a project where a model needs to become visible, understandable, and ready for discussion. You might use it to sketch the first version of a Raw Vault, work through relationships during a workshop, prepare for an architecture review, or create a consistent diagram for technical documentation.

Once the visual model is agreed upon, the engineering work still remains. Your chosen implementation and automation tools are responsible for creating tables, building loading patterns, transforming data, testing pipelines, and deploying the solution to the target platform. Visual Data Vault complements those tools; it does not try to replace them.

The same clear boundary applies elsewhere. Visual Data Vault is not a full metadata or lineage platform, and it is not currently a real-time multi-user modeling environment. Its purpose is more direct: make Data Vault diagrams easier to create, enrich, maintain, and exchange.

We believe that focus is useful. Data Vault practitioners should not have to rebuild their modeling language from generic shapes every time they start a diagram. They should be able to open a canvas that already understands the work they want to do.

Create your first model

Visual Data Vault brings Data Vault entity types, technical modeling detail, diagram management, and useful export formats into one browser-based workspace, and it is completely free to use.

Open Visual Data Vault and create your first diagram at no cost. The next time your team discusses a Data Vault design, you will have a clear model everyone can see, review, and understand.

Open Visual Data Vault

Czech Dreamin 2026: Navigating the Future of Salesforce and Automation

Salesforce Team at Czech Dreamin 2026

Discover how our team gathered the latest insights at Czech Dreamin 2026 to help you optimize your Salesforce architecture, reduce costs, and automate processes effectively.

Looking back at our trip to Prague, our three-person Salesforce team has unpacked a lot of inspiration from the Czech Dreamin 2026 conference. While our daily focus is on driving your projects forward through expert consulting, events like this give us a valuable 360-degree view of where the Salesforce ecosystem is heading and how we can apply these trends to your business.

Salesforce Team at Czech Dreamin 2026

The Bottom Line: Business Value First

The main takeaway for decision-makers is clear: modernizing your Salesforce instance is fundamentally about future-proofing your business and minimizing risks. By focusing on smart architecture and the right automation tools, you can significantly reduce development costs and eliminate long-term maintenance drivers, all while getting rapid results.

The Evolving Salesforce Ecosystem

The platform is shifting, and we are adapting our strategies to give you the best competitive edge. Based on the keynotes and latest announcements, we see three major strategic shifts:

  • The Next Era of Sales and AI Integration: Salesforce is heavily rebranding and evolving its core products. For example, we are seeing the transition of the classic Sales Cloud towards “Agentforce Sales.” Beyond just naming changes, there is a massive push towards centralized AI management. As highlighted by recent Dreamforce updates, organizations will soon have a centralized view of all ALM Coding Agents, complete with comprehensive guidelines and monitoring. Furthermore, integrations with advanced models like Claude are becoming possible. We keep track of these changes so you can leverage the newest capabilities securely and without confusion.
  • New Avenues for Quoting and Document Generation: With traditional CPQ solutions falling away or becoming overly complex for some use cases, we are proactively positioning ourselves as a Solution Partner for powerful alternatives. Our goal is to secure and streamline your quoting and document generation processes with modern, agile tools. By utilizing advanced, lightweight document generation engines, we can offer effortless custom font integration without additional overhead, precise template definition via fields, and smart document parsing. These modern platforms allow us to build highly customized, automated document workflows at a highly competitive cost structure, ensuring rapid results without the massive maintenance overhead of traditional enterprise systems.
  • Flow as the Core Engine for Business Logic: Automation via Flow Features remains a massive priority and the absolute go-to tool for building sustainable, agile business logic. We are moving towards “Better Screen Flows” by using flows as modular components for smaller steps and connecting them seamlessly. By making flows fully reactive with formulas and dynamic actions, and customizing elements using Unofficial SF and new Salesforce native components, we can dramatically enhance the user experience. Additionally, new UI optimization techniques allow us to adjust the style of screen flow components using HTML and Text Templates, making the interface far more intuitive for your end users.
Salesforce Czech Dreamin

Architecture & Alignment: Discover Before You Build

Do you ever feel like project expectations and technical reality clash? A central theme of the event was the importance of matching client expectations with Salesforce reality. The secret to a successful implementation is on-demand communication before taking action on a project. By aligning early, we help you prevent a messy, unmanageable “spaghetti structure” in your org, ensuring long-term stability and a lower Total Cost of Ownership.

Smart Automation for Rapid Results

We saw impressive use cases demonstrating how modern integration can transform everyday tasks. For instance, one company showcased a highly efficient hiring automation process using a chatbot integrated between Salesforce and WhatsApp. The system automatically updates call logs and writes data directly back to Salesforce from the chat.

Another huge efficiency booster is the automation of internal processes. By leveraging “User Access Policies,” Flows can be used to automatically grant permission set assignments for new hires. This allows you to set up licenses seamlessly, meaning you don’t need to do it manually anymore—saving valuable administration time.

Salesforce Czech Dreamin

Security First: The 24-Hour Rule

Cyber security is not just an IT issue; it’s a leadership mandate. A very pragmatic presentation highlighted the critical steps to take in the first 24 hours after a Salesforce data breach. The most important rule: immediately block and close the connection to the leak instead of trying to find the reason first. Only after the leak is stopped and contained should you begin investigating the source.

Conclusion: Our Roadmap

By combining robust architecture with the latest automation tools, we ensure your Salesforce environment remains agile, safe, and cost-effective. The conference confirmed that focusing on process excellence is exactly the right path forward.
Prague, we will definitely see you again for the next Czech Dreamin!

How to Set Up dbt with Databricks in 15 Minutes

Get Started with dbt and databricks

Getting Started With dbt on Databricks

dbt (data build tool) has become one of the most popular ways to transform data directly inside a modern cloud platform. Paired with Databricks, it gives data teams a clean, version-controlled workflow for turning raw, already-ingested data into trusted, well-modeled tables — without ever leaving the lakehouse. If you have never connected the two before, the encouraging part is that going from an empty environment to your first working models takes only a few minutes.

The path is straightforward: understand what dbt is actually responsible for, set up a Databricks environment, launch dbt through Partner Connect, initialize a project, define your sources, and build your first staging and dimension models — right through to committing your work with version control. The walkthrough below covers each step in order.


What dbt Does (and What It Doesn’t)

Before touching any configuration, it helps to be clear about one core concept. dbt is built strictly for the transformation step of your data pipeline. In the language of ETL or ELT, dbt owns the “T.” It does not extract data from source systems, and it is not the tool that loads raw data into your platform. Instead, it expects that some data already lives inside your warehouse or lakehouse, and its job is to reshape, clean, and model that data into something analytics-ready.

On Databricks, that means your raw data should already be sitting in the lakehouse before dbt enters the picture. From there, dbt takes over the modeling work: building staging layers, applying business logic, and producing the dimensional or analytical models your reporting depends on. Keeping this boundary in mind avoids a common early misconception — dbt is not an ingestion tool, it is a transformation framework.

Setting Up Your Databricks Environment

To follow along, you need access to a Databricks workspace. If you do not already have one, a free trial is enough to complete every step described here. Search for the Databricks free trial, create your account, and you will have a workspace ready within a minute or two.

Once your workspace is available, you have somewhere for dbt to connect to and somewhere for your transformed models to land. That is the only prerequisite on the Databricks side before bringing dbt into the workflow.

Launching dbt Through Databricks Partner Connect

The simplest way to stand up dbt against Databricks is through Partner Connect, the marketplace section of the workspace where Databricks lists integration partners with their connection settings pre-configured. Open Partner Connect, search for dbt, and you will find dbt Cloud listed among the available integrations. Selecting it opens the connection flow.

If you do not already have a dbt account, you can enter the same email you used for your Databricks trial. dbt then provisions a trial account for you with the connection credentials and settings already populated, so you do not have to wire up the connection by hand. After confirming, you land on the dbt Cloud dashboard, where the Databricks Partner Connect trial is shown and ready to use.

From the dashboard, opening the cloud-based development environment takes a moment to load, and you are dropped into an empty project — the blank canvas for your first models.

Initializing Your First dbt Project

An empty project needs structure before you can build anything. Initializing a dbt project scaffolds that structure for you: with a single action, dbt generates the full folder layout, configuration files, and a set of example SQL models, all visible in the file explorer.

Opening the models example folder reveals a handful of starter models you can inspect right away. If you simply want to confirm everything works end to end, you can run a build immediately. The build compiles and runs the example models in a few seconds and also executes the default tests that ship with them — typically a not-null test and a uniqueness test. Because one example model deliberately produces a row with a null value, the not-null test is expected to fail. That “failure” is intentional and confirms that dbt’s testing layer is functioning, not that something is broken.

Back in your Databricks workspace, refreshing the Partner Connect schema shows the freshly created model sitting alongside the connection schema. The round trip — build in dbt, see the result in Databricks — is the loop you will repeat for every model you create.

Defining Your Data Sources

Before building your own models, dbt needs to know where your raw data comes from. This is the role of a sources file. Deleting the example folder and starting clean, you create a sources.yml file that points dbt at data you have already ingested into the lakehouse.

The Databricks sample data is perfect for a first run. Using the Bakehouse sample dataset, you can focus on two tables — the sales customers table and the sales transactions table — to keep things simple. A minimal sources definition looks like this:

sources:
  - name: bakehouse
    database: samples
    schema: bakehouse
    tables:
      - name: sales_customers
      - name: sales_transactions

Here the source name is your own label, the database and schema point to where the data physically lives in Databricks, and the tables list the specific objects you want dbt to be aware of. Saving the file (using the save action or Ctrl+S) registers these sources for the rest of your project.

Generating Your First Staging Models

With sources defined, dbt can do a lot of the boilerplate for you. The development environment detects the tables in your sources file and offers to generate a staging model for each one. Choosing to generate a model for the sales customers table produces a simple staging model in seconds.

The generated model is a clean Common Table Expression that leverages dbt’s source() macro — Jinja syntax that resolves to the correct Databricks object at run time — and references the Bakehouse source you defined:

with source as (
    select * from {{ source('bakehouse', 'sales_customers') }}
),

renamed as (
    select
        first_name as name,
        -- additional columns
    from source
)

select * from renamed

The generator includes a renaming layer but leaves the actual renaming to you — that final shaping is where your modeling decisions live. For example, renaming the source’s first_name column to a cleaner name is a typical first edit. Once you are happy with the model, building it runs in a couple of seconds. A successful run reports its timing (often under two seconds) and confirms the model now exists in your database.

Refreshing the schema in Databricks reveals the new staging view — for example, stg_bakehouse__sales_customers — with every column present and your rename applied. Repeating the same generate-and-build flow for the sales transactions table gives you a second staging view. dbt automatically organizes these into subfolders for tidy project structuring, so a staging folder and a Bakehouse subfolder appear, each holding its corresponding SQL model and a matching configuration file.

Building a Dimension Model With ref()

Staging models give you clean, renamed source data. The next layer is where you build the analytical models your business actually consumes — for example, a customer dimension. To keep the project organized, create a new folder for your information marts, then add a SQL file such as customer_dimension.sql, since every dbt model is simply a SQL file.

The key technique at this layer is the ref() function. Instead of hard-coding a table name, you reference the staging model by its name, and dbt resolves the dependency for you. A straightforward dimension that selects all columns and filters to a single market — customers in the USA, say — looks like this:

select *
from {{ ref('stg_bakehouse__sales_customers') }}
where country = 'USA'

Building this model produces the customized dimension in Databricks, complete with all its columns and the filter applied. Because you used ref() rather than a literal table name, dbt now understands that this dimension depends on the staging model, which in turn depends on the source — a chain it tracks automatically.

Tracking Data Flow With the Lineage Graph

One of the most useful features of dbt is its lineage graph. As soon as your models reference one another through ref() and source(), dbt can draw the full dependency graph. Opening the lineage view shows the source table — the Bakehouse customer data — flowing into your staging model, and the staging model flowing into your customer dimension model.

This makes it easy to see exactly where any piece of data comes from and how it is transformed along the way. As projects grow, that visibility becomes invaluable for debugging, impact analysis, and onboarding new team members who need to understand the model landscape quickly.

Version Control and Committing Your Work

Everything you build in dbt is backed by version control. As you create and edit files, the history panel records what was created, edited, or modified, exactly as you would expect from any Git workflow. When you are ready to save your progress, you write a commit message — something like “created first models” — and commit your changes to the main branch.

From there, the usual Git capabilities are available: creating additional branches, switching between them, and opening pull requests. By default, dbt provides managed repositories so you can get started without any setup, but you are free to connect your own provider — GitHub, Azure DevOps, GitLab, or whatever your team already uses. This means your modeling work fits naturally into existing engineering practices rather than living in isolation.

Where dbt and Data Vault Meet

The workflow above scales far beyond a couple of sample tables. The same building blocks — sources, staging models, ref()-based dependencies, testing, and lineage — are exactly what you need to implement a robust, automated Data Vault on a modern lakehouse. dbt’s modularity and dependency management make it a natural fit for the repeatable, pattern-driven loading that Data Vault is built around.

If you want to go deeper into designing and automating these patterns the right way, structured learning makes a real difference. Scalefree’s Data Vault 2.1 Training & Certification covers the methodology end to end, from modeling fundamentals to production-grade automation on platforms like Databricks.

Start Building With dbt on Databricks

Getting dbt running on Databricks is genuinely a matter of minutes: connect through Partner Connect, initialize a project, point dbt at your sources, and let it generate the staging models you can then refine into dimensions and beyond. With version control and lineage built in from the very first commit, you are not just producing tables — you are establishing a maintainable, transparent transformation layer you can grow with confidence. Spin up a workspace, follow the steps above, and your first models will be live before you know it.

Watch the Video

Data Lakehouse Explained: Where Lakes, Warehouses, and Data Vault Meet

Data Lakehouse

One question comes up again and again in modern data architecture discussions:

“If we move to a Lakehouse, do we still need Data Vault?”

The reasoning sounds logical: modern Lakehouse platforms let you query structured data directly from cloud storage – no separate Raw Vault or Business Vault layers required in between. On top of that, built-in time travel provides point-in-time access across tables, which looks a lot like historization without the extra modeling effort. If the platform already handles storage, compute, format, direct access, and a form of history, the need for a full Data Vault methodology starts to feel less obvious.

It is a fair question. To answer it properly, we first need to clarify the core concepts behind Data Lakes, Data Warehouses, Data Lakehouses, and Data Vault. Only then can we understand where these concepts overlap, where they differ, and how they can work together in a modern data architecture.

Data Lakehouses Explained: Where Lakes, Warehouses and Data Vault Meet

Discover how Data Lakehouses combine the flexibility of Data Lakes with the reliability of Data Warehouses to transform modern data architecture. In this webinar, we break down these core concepts and explore exactly where Data Vault fits into the picture. Join us to learn how a well-designed Lakehouse can reduce complexity, optimize your Total Cost of Ownership (TCO), and build a future-ready foundation for advanced analytics and AI. Learn more in our upcoming webinar on July 21st, 2026!

Sign Up For Free

Defining the Core Concepts

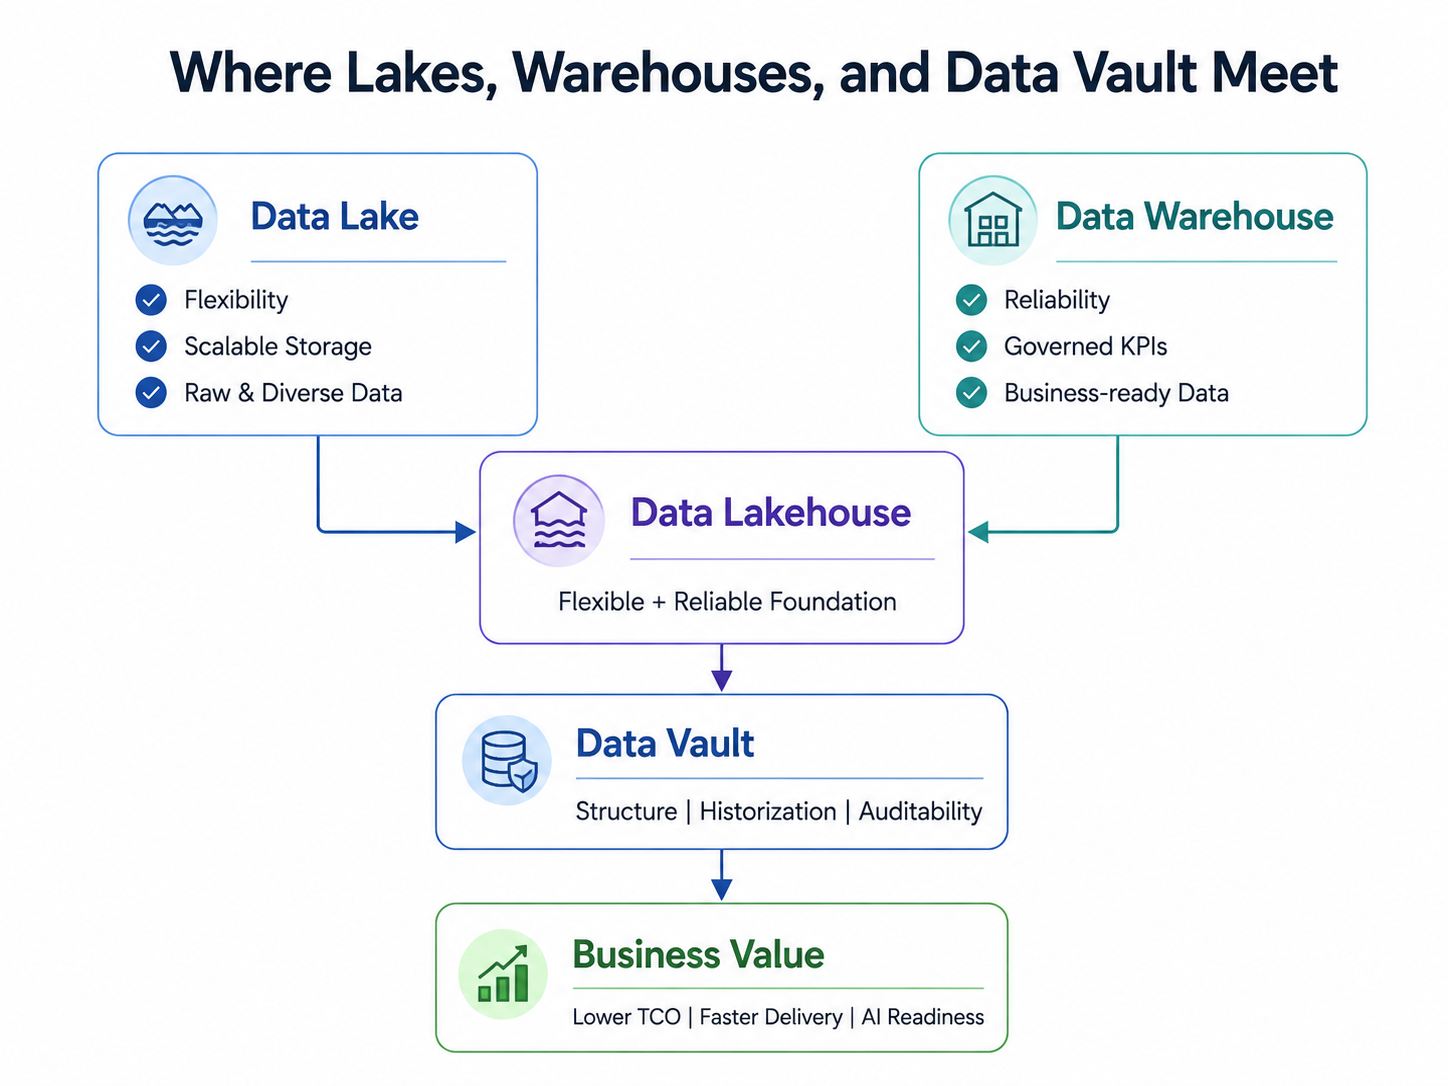
The public discussion around Data Lakehouses is often heavily vendor-driven. Many platforms promise lower Total Cost of Ownership, faster delivery, and better AI readiness. A well-designed Lakehouse architecture can genuinely support these goals. But only when it is treated as what it really is: an architectural pattern, not just a product you buy.

The Data Warehouse was designed to solve the trust problem. Governed KPIs, structured models, and business-ready data are what make BI dashboards reliable. The trade-off is that classical Data Warehouse architectures can become expensive at scale and are not always ideal for semi-structured data, machine learning workloads, or rapid experimentation.

The Data Lake was designed to solve the flexibility problem. It provides scalable storage, supports many data types, and creates room for exploration, data science, and advanced analytics. But without governance, clear ownership, and structure, many Data Lakes turn into Data Swamps. Finding trusted data then becomes a challenge instead of an advantage.

The Data Lakehouse tries to bring both worlds together: warehouse-like reliability on lake-like storage. Open table formats such as Apache Iceberg, Delta Lake, and Apache Hudi make it possible to add capabilities like ACID transactions, schema evolution, and time travel closer to the storage layer. That part is genuinely exciting.

But there is an important caveat that often gets lost in the hype.

Data Lakehouse Explanation Graphic

The Catch: Trust Is Not Automatic

A Lakehouse does not automatically create trust. It does not automatically deliver clean KPIs, consistent business definitions, proper historization, or clear ownership. A modern Lakehouse without architectural discipline can still become a modern Data Swamp. The platform may be more scalable and cost-efficient, but the structural problems do not disappear just because the data has moved to a new storage layer.

Lakehouse vs. Data Vault: Different Layers, Different Jobs

This is exactly where Data Vault comes back into the picture.

The framing of “Lakehouse vs. Data Vault” is, in my view, the wrong comparison. A Lakehouse is a platform and architecture pattern. Data Vault is a modeling and integration methodology. They operate on different layers. The Lakehouse describes where and how data can live. Data Vault describes how to model, integrate, historize, and audit data across multiple sources.

Historization: Time Travel vs. Data Vault

A common reaction to this is:

“But Lakehouses already give me time travel and snapshots, so I do not need Raw Vault or Business Vault for historization, do I?”

It is a fair assumption, but it conflates two different things. Time travel at the table format level is a powerful operational feature, valuable for short-term rollbacks and point-in-time queries on a single table. But it is not a replacement for long-term, integrated business historization across sources. Snapshots are subject to retention policies and storage maintenance routines such as VACUUM, snapshot expiration, or cleaner processes, which means they are not built for audit-grade traceability over years. Data Vault, by contrast, follows an insert-only modeling pattern that integrates entities across systems and supports long-term, auditable historization. Both have value, but they solve different problems on different time horizons.

Data Lakehouse Comparison

The Synergy in Modern Data Architectures

In modern data architectures, the two can fit together very naturally. The Lakehouse provides the scalable and flexible foundation. Data Vault provides the structure that makes the data trustworthy enough for reporting, analytics, and increasingly for AI use cases. Raw Vault, Business Vault, and Information Marts can be implemented on top of a Lakehouse foundation. It is not necessarily an either-or decision.

What does this mean in business terms? A Lakehouse can help reduce duplicated storage and lower the Total Cost of Ownership. Combined with a proper modeling and governance layer, it can also reduce maintenance effort, prevent expensive reengineering cycles, and give teams the agility to deliver new data products faster.

Data Lakehouse

Conclusion

A Lakehouse is a powerful foundation, but it is not a shortcut around architecture. Those cost and agility benefits are real – but none of it replaces the need for clear modeling, governance, and historization. This is why Lakehouse and Data Vault are not competitors but partners: the Lakehouse provides the scalable foundation, and Data Vault provides the structure that keeps your data trustworthy, integrated, and auditable.

So the answer to our opening question is simple: no, a Lakehouse does not replace Data Vault – it gives it a more flexible foundation to run on.

Want to go deeper on this?

Join our upcoming webinar: Data Lakehouses Explained: Where Lakes, Warehouses, and Data Vault Meet. We will clarify what Data Lakes, Data Warehouses, and Data Lakehouses really are, explain why a Lakehouse is an architectural pattern rather than a shortcut around design, and show where Data Vault fits into a modern Lakehouse architecture. Whether you are exploring Lakehouses for the first time or weighing them against your existing Data Warehouse and Data Vault setup, you will leave with a clear framework for evaluating your own platform.

Join us on July 21st.
Register for free here

Google BigQuery and dbt Cloud Quickstart: Full Setup Guide

Smiling man in a white shirt points to the left at a blue-to-teal gradient background with the text 'BUILD IT' and colorful logo icons to the left.

Get Started with Google BigQuery and dbt Cloud

If you are looking to build a modern, scalable data transformation workflow, combining dbt Cloud with Google BigQuery is one of the most powerful stacks available today. In this guide — based on a hands-on walkthrough video — we cover everything from setting up your Google Cloud project to running your first automated deployment job. Whether you are new to analytics engineering or already familiar with SQL-based transformations, this tutorial will get you productive quickly.


What Is dbt and Why Does It Work So Well with Google BigQuery?

Before diving into the setup steps, it helps to understand what each tool actually does and why they complement each other so naturally.

dbt (data build tool) is an open-source transformation framework that brings software engineering best practices into data teams. With dbt, your SQL code is version-controlled, tested, documented, and executed through scheduled jobs — the same discipline that software engineers apply to application code. You write modular SQL models, dbt compiles them, and the actual query execution happens entirely on your data platform.

Google BigQuery is a fully managed, serverless cloud data warehouse built for large-scale analytics. It handles the storage and compute, scales automatically, and integrates tightly with the broader Google Cloud ecosystem. Critically for this tutorial, BigQuery hosts publicly available datasets you can query immediately — no manual data loading required to get started.

Together, dbt and BigQuery form a clean separation of concerns: dbt manages your transformation logic, documentation, and pipeline orchestration, while BigQuery handles the heavy lifting of storing and querying your data at scale. This makes the combination especially attractive for analytics engineering teams that want speed, reliability, and maintainability.

Step 1: Set Up Your Google Cloud Project and BigQuery Dataset

Everything starts in the Google Cloud Console. If you do not already have a Google Cloud account, you can start for free — Google offers around $300 in credits with no credit card required upfront, which is more than enough for this quickstart.

Once you are in the console, navigate to the Cloud Resource Manager and create a new project. For this demo, a name like bigquery-dbt-quickstart works well. After the project is created, head to the BigQuery console from the main navigation menu.

In BigQuery, you will immediately notice that the terminology differs slightly from traditional databases. Instead of database → schema → table, BigQuery uses project → dataset → table. The concepts map directly, but knowing this terminology prevents confusion when you are configuring dbt later.

Create a new dataset inside your project — call it something like dbt_demo. During creation, you will be asked to set a data location (choose a region that makes sense for your use case, or a multi-region option like US or EU), an optional expiration policy, and an encryption setting. The defaults are fine for a quickstart.

The public tutorial data you will be using lives in a project called dbt-tutorial, under a dataset named jaffle_shop. It contains customer and order tables — exactly what you need to build a meaningful first model.

Step 2: Create a Service Account and Generate a JSON Key

For dbt Cloud to run queries in BigQuery on your behalf, it needs authenticated access. The most straightforward approach for a quickstart is a Google Cloud service account with a JSON key file.

In the Google Cloud console, use the Credentials Wizard under APIs & Services to create a new service account. Name it something like dbt-user. Assign it two roles:

  • BigQuery Data Editor — allows the service account to create and modify tables
  • BigQuery User — allows it to run jobs against the project

Once the service account is created, open it and navigate to the Keys tab. Create a new JSON key. This downloads a file to your local machine — keep it secure and do not commit it to version control. You will upload it to dbt Cloud in the next step.

Note: In a production environment, you would typically use OAuth or Workload Identity Federation rather than a JSON key file. For this quickstart, the service account key is the simplest and most transparent option.

Step 3: Connect dbt Cloud to BigQuery

With your service account key ready, log in to dbt Cloud and create a new project. When prompted to set up a connection, choose BigQuery and upload the JSON key file you just downloaded. dbt Cloud will parse the file and automatically populate your project and credential details.

Set a target name for the connection — something like dbt-demo — and save. For the repository, this demo uses dbt’s managed Git repository, which is the quickest option. In a real production project, you would connect dbt Cloud to your own GitHub, GitLab, or Azure DevOps repository and use pull requests and CI/CD pipelines to manage code changes properly.

Step 4: Initialize Your dbt Project

Open the dbt Cloud Studio (the browser-based IDE). You will see a button in the top-left to initialize your dbt project. Click it — dbt will automatically generate the standard project scaffold, including the dbt_project.yml file and a default folder structure.

The dbt_project.yml file is the configuration file that tells dbt this folder is a dbt project. It is where you set the project name, define global defaults, and configure materialization strategies per folder. Every SQL model you place inside the models/ folder from this point forward can be compiled, tested, documented, version-controlled, and executed against BigQuery automatically.

You will also notice that the initializer creates some example models. Delete the examples/ subfolder inside models/ to start with a clean structure — but be careful not to delete the models/ folder itself.

Once your project structure looks clean, commit the initial files with a message like project initialization and you are ready to start building.

Step 5: Define Your Sources

In dbt, sources are the starting point of every project. They tell dbt where your raw input data lives — which project, dataset, and table — without hardcoding those references directly into each model file. This makes your project far more maintainable: if a source location changes, you update it in one place and every model that uses it automatically picks up the change.

Create a new file in your models/ folder and name it sources.yml. The structure always starts with version: 2 (required for the current dbt YAML schema), followed by a sources: key. Under that, define a source with a name (for example, jaffle_shop), specify the BigQuery project as the database (dbt-tutorial), the dataset (jaffle_shop), and list the individual tables you want to reference — in this case, customers and orders.

After saving the file, the dbt Cloud lineage panel will update to show your newly recognized sources. They will appear as the entry points in your project’s data lineage graph.

Step 6: Build Staging Models

A core best practice in dbt is to never reference raw source tables directly in your business logic models. Instead, you create a thin staging layer — one model per source table — that lightly cleans and standardizes the data. Typical staging transformations include renaming columns to consistent naming conventions, casting data types, and filtering out clearly invalid records.

dbt Cloud makes this step even easier: the lineage view shows a link next to each detected source table that lets you auto-generate a staging model scaffold. Click it, and dbt generates a boilerplate SQL file using Common Table Expressions (CTEs) and the source() macro.

The source() macro is one of the first things that makes dbt feel different from plain SQL. Instead of writing SELECT * FROM dbt-tutorial.jaffle_shop.customers, you write SELECT * FROM {{ source('jaffle_shop', 'customers') }}. dbt compiles this at runtime into the correct fully qualified BigQuery reference, keeping your code clean and location-independent.

In the staging model for customers, rename the id column to customer_id for clarity. Save the file and use the Preview button to verify that dbt can query the data from BigQuery — this confirms your connection and credentials are working correctly.

When you are ready to persist the model, click Build. dbt will create the model in BigQuery under your personal development dataset — a sandboxed schema tied to your dbt Cloud user account. This means you can build and iterate on models freely without touching anything in your production environment.

If you switch back to the BigQuery console at this point, you will find a new dataset named after your dbt username, and inside it, a view representing your staging model. Repeat the same process for the orders source table.

Step 7: Build a Customer Dimension Model

With your staging models in place, you are ready to build a more meaningful transformation: a customer dimension that joins customer data with order history.

Create a new folder inside models/ called marts/ (a common convention for final output models), and inside it create a file called dim_customers.sql.

In this model, instead of the source() macro, you will use the ref() function — the other core dbt macro. Where source() points to raw input tables, ref() points to other dbt models you have already defined. Writing {{ ref('stg_jaffle_shop__customers') }} does two things: it generates the correct BigQuery reference at compile time, and it tells dbt that this model depends on the staging model — building the dependency graph that dbt uses to determine build order, enable lineage tracking, and support documentation.

Build out the model with a few CTEs: one that selects from your customers staging model, one that aggregates order data per customer (first order date, most recent order date, and total order count), and a final CTE that joins the two together. The lineage panel will update to show the full data flow from raw sources through staging into the dimension model — a powerful visualization, especially as your project grows.

Build the model, verify it in BigQuery, then commit your changes and merge to main.

Step 8: Create a Deployment Environment and Schedule a Job

Development work happens in personal dev environments. Production data transformations require a deployment job — a configured, scheduled run that executes your models against your production BigQuery dataset.

In dbt Cloud, navigate to Orchestration → Environments and create a production environment. You will need at minimum one development environment and one production environment. Attach a connection profile to the production environment that points to the dbt_demo dataset you created earlier — this is where production models will be materialized.

Then go to Orchestration → Jobs → Deploy Job and create a new job. Name it something like Production Daily, select your production environment, and configure the run command as dbt build (which compiles, runs, and tests all models in one step). Enable a schedule — for example, daily at 2:00 AM using either the UI scheduler or a cron expression for more precise control.

You can also trigger the job manually to verify it runs successfully. The job run view shows the status of each model — pass, fail, or skip — making it easy to spot and debug issues in production.

What to Learn Next: Data Vault, dbt, and Scalable Analytics Engineering

What you have built in this walkthrough — connecting dbt Cloud to Google BigQuery, defining sources, creating staging and dimension models, and scheduling a deployment job — represents the foundational workflow you will use in every real analytics engineering project.

But this is just the beginning. dbt supports a wide range of advanced features: custom tests, documentation generation, macros and Jinja templating, incremental models for large datasets, snapshots for slowly changing dimensions, and much more.

If you want to go deeper and learn how to combine dbt with structured modeling methodologies, Data Vault 2.0 is the industry standard for building scalable, auditable, and future-proof enterprise data warehouses. At Scalefree, we offer comprehensive Data Vault 2.1 training and certification programs that cover everything from foundational concepts to advanced implementation patterns — including how to integrate dbt into a Data Vault workflow on platforms like BigQuery.

Whether you are just starting your analytics engineering journey or looking to formalize your team’s approach to data modeling, our Data Vault 2.1 certification is the most direct path to building production-grade data platforms with confidence.

Check out our other platform-specific tutorials — including guides for Snowflake — and explore our webinars and training programs to take your data engineering skills to the next level.


Watch the Video

How Data Vault Supports AI and ML Readiness in the Modern Data Platform

Hologram of Padlock on sunset panoramic cityscape of Bangkok, Southeast Asia. The concept of cyber security intelligence. Multi exposure.

How Data Vault Supports AI and ML Readiness

Most organisations today are not failing at AI because they chose the wrong model. They are failing because they built on the wrong foundation. The model is rarely the bottleneck — the data underneath it is.

At Scalefree, working with clients across Europe, we see this consistently: AI workflows will never succeed at scale without proper data support. Not eventually. Always.

This article explains why, and what a mature, AI-ready data architecture actually looks like — with Data Vault 2 at its core.


Where Most Companies Are Right Now

The journey most organisations follow with AI looks roughly the same. It starts with discovery — the first time someone opens a chatbot, enters a prompt, and gets a result that genuinely surprises them. That moment creates momentum.

What follows is an extended period of experimentation. Prototypes are built. Some use cases work. Others fail — not because AI is incapable, but because the setup was wrong, or the use case was not worth the complexity it introduced. This phase is characterised by learning, and by a growing realisation that surfaces quickly: the same problems data engineers have been solving for 20 or 30 years have not gone away. They have simply reappeared under a new name.

Structured processes are needed. Governance is needed. Data integration is needed. The foundation matters — and for many organisations, that foundation is not ready.

The companies that move beyond experimentation into genuine AI maturity are not the ones that found a better model. They are the ones who built a better platform first.

Reasons That Stop Companies From Scaling with AI

Two patterns emerge consistently when AI projects reach the limits of their initial setup.

The first starts innocently. A workflow tool is connected to a data source and a language model. It works. Results are impressive. Then a second data source is added, then a third. A quality control step is introduced. A loop is needed. A second agent handles edge cases. What started as a clean prototype becomes a tangled, fragile system that is expensive to maintain and nearly impossible to debug. When errors appear — and they will — fixing them means untangling months of accumulated complexity. Multiply this across ten, twenty, or forty processes in an organisation, and the maintenance burden alone consumes any efficiency the AI was supposed to create.

The second pattern emerges from urgency. Business users want to move quickly, and internal IT is often a bottleneck. The response is shadow AI: tools adopted outside governance controls, company data uploaded to external platforms without authorisation, processes built that bypass audit trails, GDPR compliance, and data ownership rules. It produces results fast. It also creates legal exposure, data leakage risk, and a complete loss of organisational visibility into what AI is actually doing with company data. For many organisations today, if asked honestly what AI processes are running and what data they are using, the honest answer is: we do not know.

Both patterns are understandable in how they start. Both become critical problems at scale.

Why AI Workflows Fail Without a Data Foundation

The root cause in both cases is the same: attempting to solve data problems inside an AI workflow rather than before it.

When an AI agent needs to access 20 different types of information — personal contact data, past purchase history, product catalogue, past email correspondence, website behaviour, and company context — and that data lives in disconnected source systems with no integration layer, every new data point added to the workflow increases complexity. Quality issues compound. Costs rise with every additional token consumed. And because AI systems produce different results every time they process inconsistent input, errors are unpredictable and difficult to reproduce.

Clean, integrated, well-described data does not make AI smarter in a general sense. It makes AI consistently useful — which is what actually matters when deploying at enterprise scale.

The Enabling Data Platform: What It Looks Like

The architecture Scalefree recommends for AI-ready data platforms follows a clear logical structure, regardless of which specific tools an organisation uses.

Source systems feed into a Persistent Staging Area, where raw data is collected and preserved as-is. This is not a transformation layer — it is a historical record of everything that arrived, in the form it arrived in.

From there, data moves into an integration layer. This is where a Data Vault 2 modeling standard sits. The role of this layer is to integrate data from different source systems, resolve business key conflicts, clean data, and build a single, auditable, historically complete view of the business. It can grow and evolve as new sources are added, without restructuring what already exists. It is also built piece by piece, use case by use case, which means an organisation does not need to build the entire platform before deriving value from it.

Above that, the platform builds Feature Marts. Feature Marts are the direct interface between the data platform and AI agents. They are optimised for AI consumption — sometimes flat and wide, sometimes in a dimensional modeling style, with rich semantic descriptions that help an AI agent understand not just what the data is, but what it means. A Feature Mart might contain all prospect activity data in a single unified view, ready for an agent to consume without having to navigate joins, resolve conflicts, or interpret raw table structures.

AI agents plug into Feature Marts. They do not go directly to the predecessor layers, and they certainly do not go directly to source systems. The Feature Mart is the clean, governed, role-restricted interface that makes agents reliable.

How This Architecture Directly Solves the AI Scaling Problem

Security and access control. When an AI agent connects to a Feature Mart rather than a raw database, access can be scoped precisely. The agent sees only the data it needs for its specific function. If the agent is compromised, the blast radius is limited. This is the same principle applied to any employee or system — give it exactly the access it needs, nothing more.

Data integration. An organisation’s data engineers have already done the work of cleaning, integrating, and resolving data quality issues across source systems. AI engineers do not need to rebuild this. They need to collaborate with data engineers to shape Feature Marts from data assets that already exist. This is a fundamental shift in how AI teams and data teams should work together — and it accelerates the time from idea to deployed AI use cases.

Full audit trail. With a proper data platform, every piece of data that flows into an AI decision can be traced back to its source, with a timestamp. The output can also be stored back in the platform. This means that when a compliance question arises — which data informed this decision, on which date, processed by which agent — the answer is available.

GDPR and compliance. If data deletion rules are already implemented in the platform, they extend automatically to AI agents. Data that has been deleted from the platform under GDPR rules will not be served to an AI agent via the Feature Mart. Compliance is inherited, not rebuilt for each use case.

Cost control. Providing an agent with a clean, pre-integrated Feature Mart means it processes the right data once, rather than consuming tokens navigating raw, inconsistent, or duplicated data sources. Token costs are a real and growing concern for organisations running AI at scale. A well-structured data foundation is also a cost optimisation strategy.

Semantic layers. AI agents make mistakes when they do not understand the data they are working with. A data catalog and semantic layer that provides meaningful descriptions of every data asset — what a field means, how a metric is calculated, what business context surrounds a particular entity — reduces AI hallucinations significantly. This is especially important as organisations move toward conversational interfaces that allow business users to query data in natural language.

Data Vault 2 as the Foundation for AI Readiness

Data Vault 2 is not simply a modeling technique. It is a complete methodology covering architecture, modeling, and implementation standards. Its particular strengths make it well-suited as the integration layer in an AI-ready platform.

The insert-only, historically complete nature of Data Vault means that every version of every piece of data is preserved. An AI agent working with a Feature Mart derived from a Data Vault has access to the full history of a business entity — not just its current state. This matters significantly for ML models that rely on historical patterns, and for audit requirements that demand a complete record of what was known at any point in time.

Data Vault’s business-key-centred approach means that data from multiple source systems can be integrated without losing the original context of each source. An AI agent drawing on customer data that has been properly integrated through a Data Vault model is working with a single, coherent view of that customer across every system in the organisation — rather than multiple conflicting records from disconnected databases.

Data Vault 2 also extends the original methodology to address real-time and semi-structured data patterns — JSON structures, streaming sources, event-driven loading — which are precisely the data types that AI-driven workflows increasingly depend on.

Starting the Journey: Three Things to Do in Parallel

Organisations do not need a complete data platform before they begin building AI use cases. What they need is a plan to build both in parallel, with the right teams working together.

The first priority is extending the existing data platform to serve AI applications — identifying which data assets already exist, which Feature Marts can be built from them quickly, and which source systems need to be connected next.

The second priority is identifying the right processes to automate. The most valuable targets are not tasks unique to one person, but processes that many people across the organisation perform repeatedly — the same steps, executed at scale, across departments. These are the processes where AI creates compounding returns.

The third priority is building cross-functional teams. AI engineers, data engineers, and business users need to work together from the start. Business users understand the processes. Data engineers have already solved the data integration and quality problems. AI engineers know which models fit which constraints and how to optimise for cost and performance. No single group has all three — and organisations that try to run AI projects without all three perspectives will hit the limits of that approach quickly.

Want to Go Deeper?

If your organisation is evaluating its data platform readiness for AI, or if you are already building AI workflows and hitting the limitations described in this article, Scalefree offers a free Data Vault Handbook — 60 pages covering the fundamentals of Data Vault and where it fits in a modern data architecture. Available to order to your door, free of charge within Europe.

For teams ready to take the next step, the Data Vault 2.1 Training & Certification equips data engineers and architects with the methodology, modeling skills, and CDVP2.1 credential to build and govern Data Vault implementations at enterprise scale.

To discuss how Scalefree can support your data platform or AI readiness journey, get in touch directly.

Data Vault and Data Mesh: Not Versus, But Together

Best Practices for Data Mesh Implementation

Data Vault and Data Mesh

Few topics generate more confusion in enterprise data architecture than the relationship between Data Vault, Data Mesh, and Data Fabric. Online discussions often frame these as competing approaches — as if an organisation must choose one and abandon the others. This framing is wrong, and understanding why matters for anyone building a serious data platform in 2025 and beyond.

These three concepts operate at different levels. They address different problems. And when combined correctly, they complement each other in ways that none of them can achieve alone.


Data Vault, Data Mesh, and Data Fabric Are Not Competing

The confusion starts because all three terms appear in similar conversations — data platform architecture, enterprise data strategy, scalability. But they are not alternatives to each other.

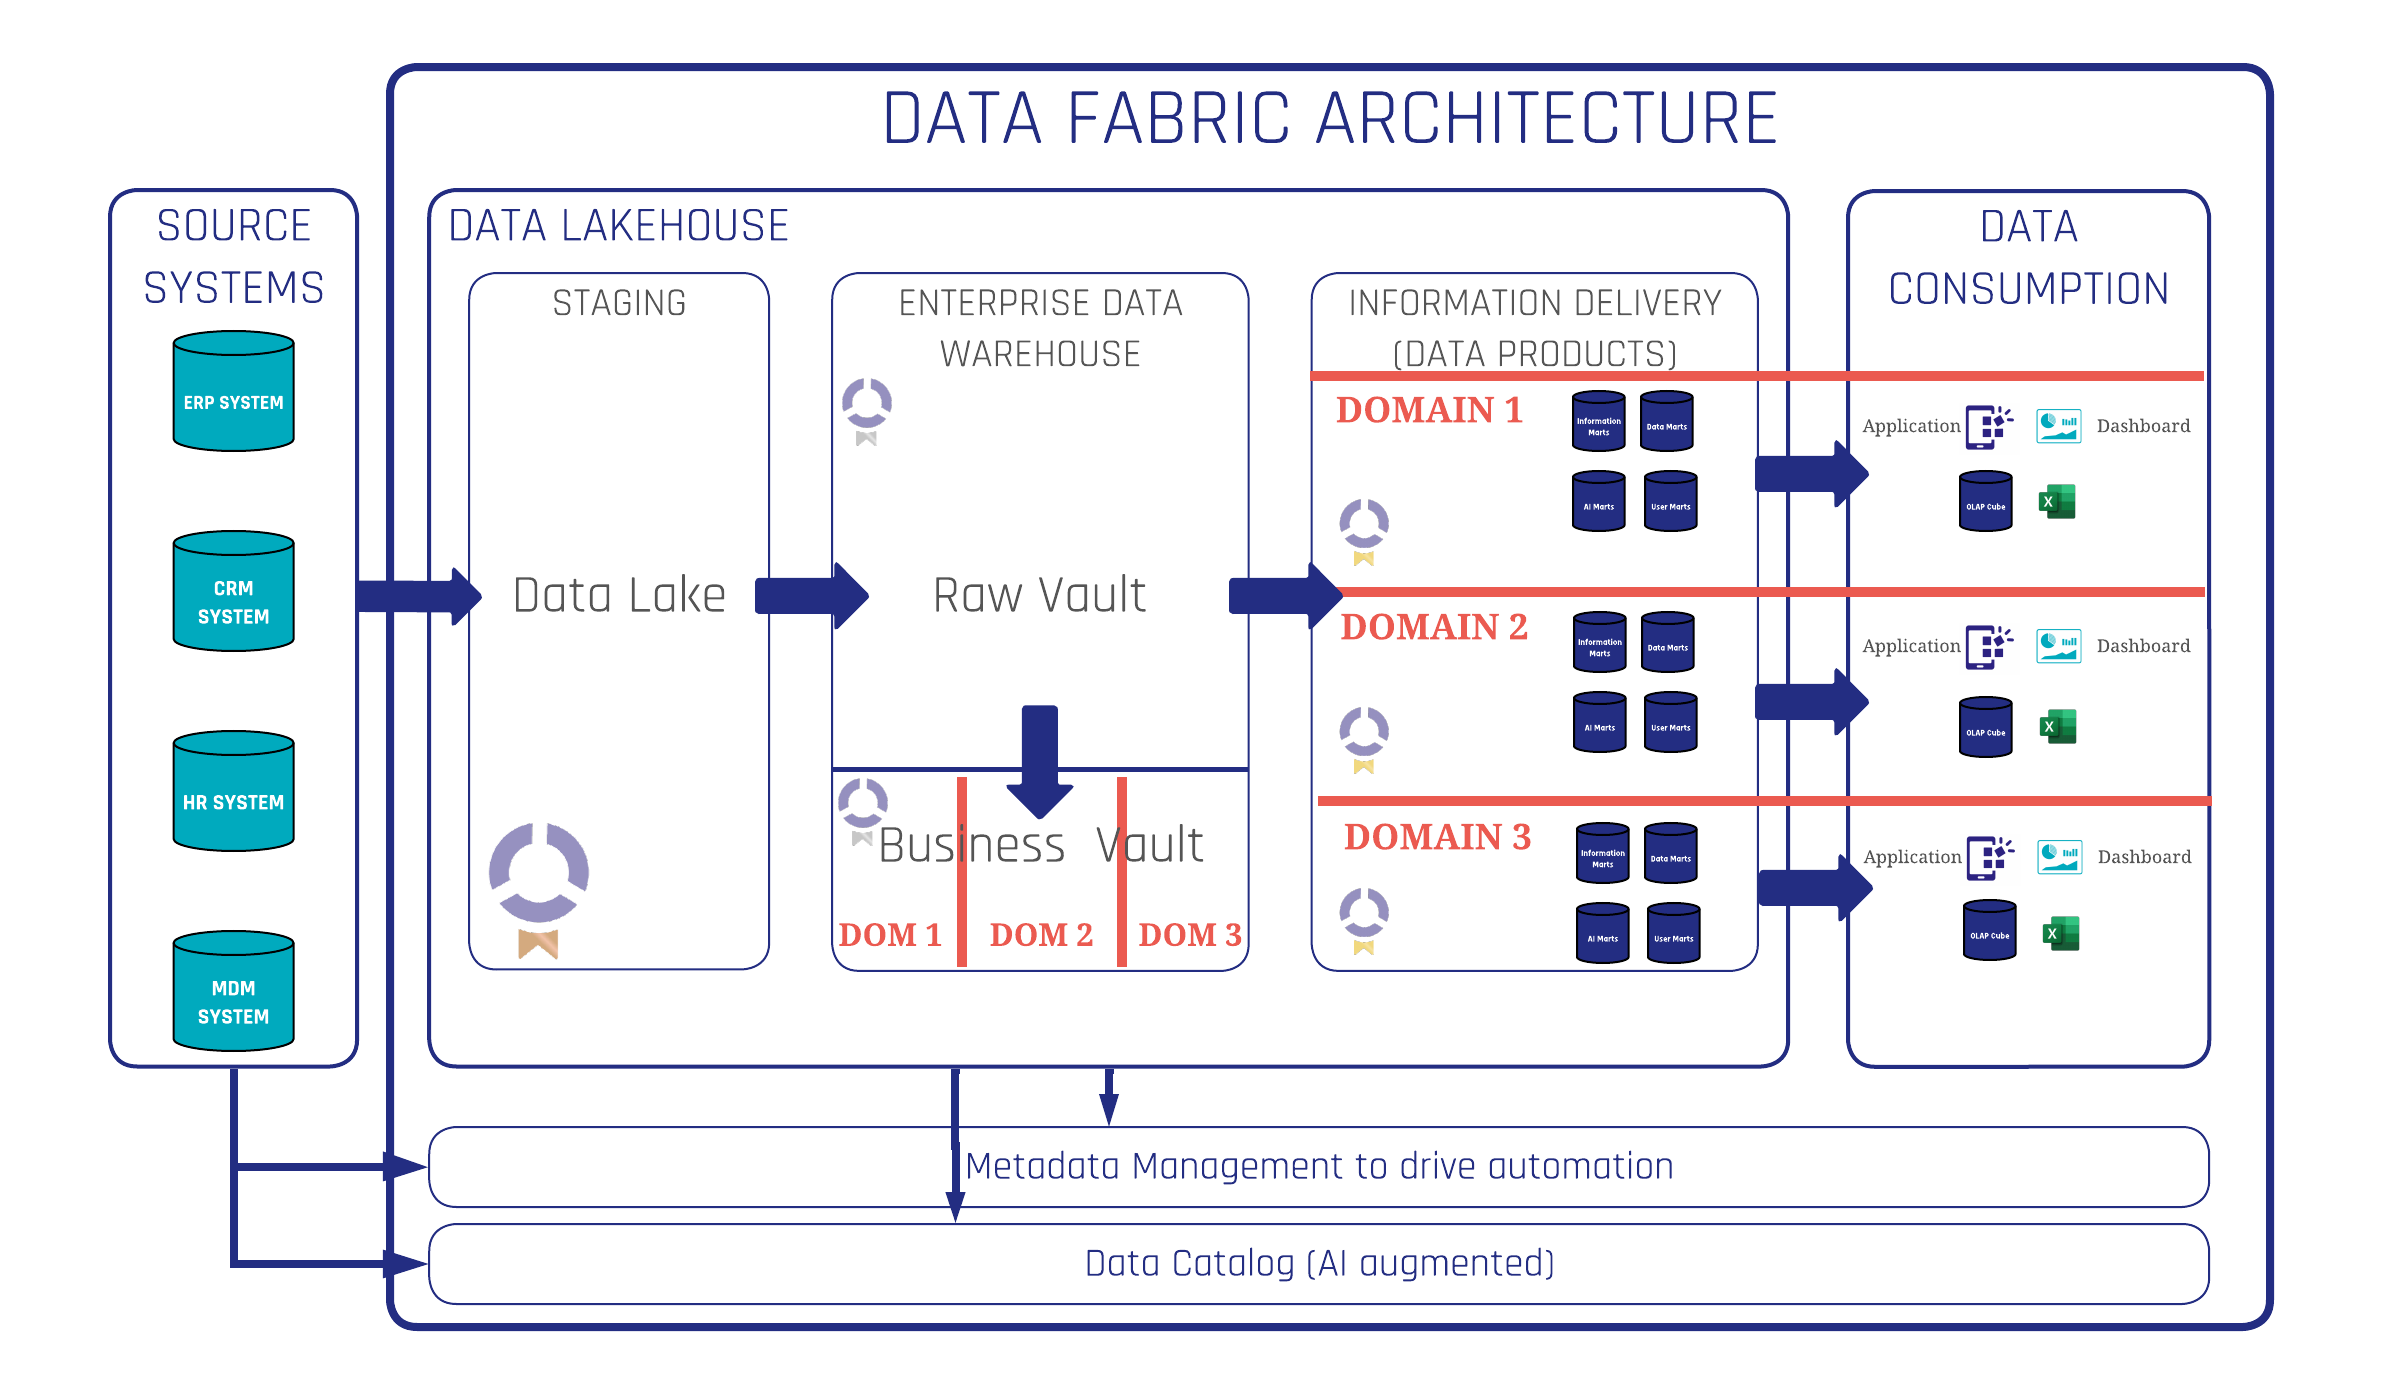
Data Fabric is a technical approach. It defines the architecture of a data platform — how data moves from source systems through integration layers to delivery, how metadata drives automation, how access is governed, and how the platform scales. It is the engineering blueprint.

Data Mesh is an organisational approach. It defines who is responsible for data, how teams are structured, how data products are owned and maintained, and how to avoid the bottlenecks that emerge when a single central IT team is responsible for everything. It is the operating model.

Data Vault is the methodology that sits between the two. It provides the modeling technique, the reference architecture, the implementation standards, and the agile delivery framework that make both a high-quality Data Fabric and a functional Data Mesh possible. It is the glue.

None of these replaces the other. An organisation can have a Data Fabric architecture without Data Vault — but it will lack the standardisation and automation that make the platform scalable. It can adopt Data Mesh principles without Data Vault — but the integration layer will be fragile and inconsistent. Data Vault without a clear architectural vision and organisational operating model delivers solid modeling but leaves the surrounding platform undefined. For a deeper look at how these three approaches fit together architecturally, Scalefree’s guide on Data Vault, Data Mesh, and Data Fabric covers the full modern architecture picture.

Why Data Vault Is the Foundation Data Mesh Needs

Data Mesh’s central argument is that centralised IT teams become bottlenecks as data platform requirements grow. The solution is to distribute ownership — giving domain teams (sales, finance, operations, logistics) responsibility for their own data products rather than routing every requirement through a central team.

This is a sound organisational idea. But it creates a serious technical problem: if every domain team builds its own data pipelines from scratch, organisations end up with redundant data, conflicting definitions of the same business objects, and a proliferation of unmaintained pipelines. The very inefficiency Data Mesh was designed to solve reappears in a different form.

Data Vault solves this problem at the architecture level. The key insight is that not all layers of a data platform benefit equally from decentralisation.

The Raw Data Vault — the layer that absorbs raw data from source systems and integrates it using business keys — should remain centralised. This layer contains no business logic. It simply records what arrived, when, and from where. Because it is standardised and highly automatable, a small central team can maintain it with minimal overhead. And because it is centralised, every domain team draws from the same single source of facts — the same customer records, the same product data, the same account structures — rather than each team pulling its own version from disconnected pipelines.

The Business Vault and Information Marts, by contrast, are exactly where domain knowledge matters. Business rules, calculated metrics, KPI definitions, and data product shaping all require the kind of deep domain understanding that lives in business teams, not in central IT. This is where decentralisation makes sense — and where Data Mesh principles directly apply.

The result is a practical middle ground: centralise the Raw Vault where standardisation creates efficiency, decentralise the Business Vault and Information Marts where domain knowledge creates value. This is not a theoretical compromise — it is the architecture that enterprise Data Vault implementations demonstrate works at scale.

The Problem With Going “Full Data Mesh”

Fully decentralised Data Mesh — where every domain team manages its own data end to end, from source ingestion to delivery — sounds attractive in theory. In practice, it replicates the problems of the pre-data-warehouse era, where every department ran its own shadow IT, built its own pipelines, and maintained its own version of business objects that nobody else could join reliably.

When domain teams each ingest their own version of a source system, the same Salesforce data gets pulled ten times by ten different teams with ten slightly different transformation approaches. The same customer appears as ten different records with ten different definitions of “active.” Joining across domains becomes a project in itself. The governance that Data Mesh promises — through federated standards and data contracts — is extremely difficult to enforce when no shared foundation exists.

Full centralisation has its own problems, of course. A single IT team responsible for all data products across a large organisation will always struggle with prioritisation, domain knowledge gaps, and delivery speed. The bottleneck that Data Mesh identifies is real.

The architecture that resolves this tension uses Data Vault’s layered structure as the boundary between centralised and decentralised work. Central team: source ingestion, Raw Vault, automation infrastructure, platform governance. Domain teams: Business Vault logic, Information Marts, data product definition, and ownership.

How This Architecture Works in Practice

Organisations that implement this combined approach typically follow an evolution rather than a big-bang restructuring. Teams begin working together on a centralised platform, building the Raw Vault and establishing the automation patterns and tooling. As the platform matures and team members develop deep platform knowledge, those people move into domain teams — bringing their technical expertise with them, closer to the business knowledge that domain work requires.

The central team shrinks to a small core — often just two or three people — responsible for maintaining the Raw Vault, the automation infrastructure, and the platform governance layer. Domain teams handle everything from the Business Vault outward, working with full autonomy on their data products while drawing on the shared, integrated foundation beneath them.

This approach has a specific advantage when organisations grow through acquisition. When a company absorbs another — bringing new source systems, new customer records, new business objects — the Raw Vault absorbs the new data without restructuring what already exists. New Hubs, new Satellites, and new integration logic are added incrementally. Existing data products continue to function. The integration project that would take a traditional data warehouse months or years can be completed in weeks.

The same scalability applies to organic growth. New business units, new products, new markets — each can be onboarded as a new domain team, drawing from existing Raw Vault entities where overlap exists, adding new entities where it does not. The platform grows with the organisation rather than requiring periodic rebuilds.

What Makes This Combination Work

Three characteristics of Data Vault make it particularly well suited as the foundation for a Data Fabric and Data Mesh architecture.

Standardisation enables automation. Data Vault’s Hub-Link-Satellite structure is highly consistent. Once the patterns are established and the metadata is defined, the loading of Raw Vault entities can be generated automatically rather than hand-coded. This is precisely what Data Fabric requires — and precisely what makes the central layer maintainable by a small team even as the number of source systems grows. For a detailed look at how datavault4dbt implements this automation approach, Scalefree’s tooling is specifically designed around this principle.

Historical completeness supports data products. Data Mesh’s concept of the data product — a trusted, documented, governed dataset that domain teams can consume and build upon — requires a reliable foundation. A data product built on a Raw Vault entity inherits complete historical data, a full audit trail, and provable lineage back to source. These are the properties that make data products trustworthy enough to use in downstream analytics, AI applications, and regulatory reporting.

The layered architecture maps naturally to organisational boundaries. Raw Vault and Business Vault are not just technical distinctions — they correspond to a meaningful organisational divide between technical data engineering work and business knowledge work. The architecture makes the organisational model explicit rather than leaving it implicit, which reduces friction when defining team responsibilities and data product ownership.

Data Catalogs and Governance as Connective Tissue

A combined Data Vault, Data Mesh, and Data Fabric architecture only delivers its full value when metadata is managed seriously. Domain teams need to be able to discover what data products already exist, understand their lineage, know how fresh the data is, and assess whether an existing product meets their needs before building a new one.

Without a well-maintained data catalog, teams rebuild work that already exists, queries return answers that conflict with other answers, and the governance that Data Mesh requires to function collapses into informal agreements and institutional knowledge held by a few individuals.

With a proper catalog — one where every data product is documented, every entity has clear ownership, every metric definition is visible, and lineage traces from source to delivery — the platform becomes genuinely self-service. Non-technical users can find and use data products without IT support. AI use cases that require querying data in natural language become feasible. And the platform can scale to serve a large organisation without proportional growth in support overhead.

Data Vault contributes directly to catalog quality. The Raw Vault’s record source and load date on every entity provide automatic lineage. The standardised naming conventions make entities discoverable. The separation of Raw Vault from Business Vault makes the application of business rules explicit and auditable rather than buried in opaque transformation logic.

Starting the Journey

For organisations considering this architectural direction, the starting point is almost always the same: begin with the data platform foundation before attempting to distribute ownership. Teams need to understand the platform — how the Raw Vault works, how automation is configured, how the Business Vault extends the raw layer — before they can work effectively within domain structures.

The Data Vault 2.1 Training & Certification equips data engineers and architects with the complete methodology — from Raw Vault design through Business Vault patterns to Information Mart delivery — so they can build and govern this kind of platform with confidence. For teams evaluating their current architecture and planning the move toward a more scalable and governed platform, Scalefree’s Data Platform Review provides an expert assessment and a clear recommended path forward.

The question is not whether to choose Data Vault, Data Mesh, or Data Fabric. The question is how to combine them in the sequence and proportion that fits your organisation’s current maturity and growth trajectory. The answer, in almost every case, starts with the same foundation: a clean, standardised, automated Raw Vault that every domain team can trust.

For further reading on how Scalefree approaches enterprise data platform architecture, the free Data Vault Handbook covers the core methodology, and the Data Vault consulting practice works with organisations at every stage of the implementation journey.

Will AI Replace Your Data Vault Engineer? We Put Conversational Analytics to the Test

AI Fact Table Comparison

Scalefree tested whether AI can replace a Data Vault Engineer. The accuracy was perfect. The effort and performance gap told a very different story.

Every data team is asking the same question right now. If AI can write SQL, generate documentation, and query complex structures on its own, what exactly is the Data Engineer still doing?

Can an AI agent query a Raw Data Vault on its own? Does a business still need experienced engineers to model, document, and maintain a vault if the AI can just figure it out? We ran the experiment ourselves. The results were not what we expected.

Mastering Conversational Analytics: A Practical Guide to Setup, Testing, and Optimization

Learn how to unlock the ability to “chat” with your company’s data in plain English and get instant, accurate answers using your unique metrics. This practical webinar will demonstrate a strategy that prevents AI hallucinations and implements reliable AI data assistants without requiring a massive, expensive complexity overhaul. Sign up for our upcoming webinar on June 16th, 2026!

Register for free

Sound Familiar?

Your LinkedIn feed is full of it. “AI can write SQL.” “Just ask your data a question.” “No engineer needed.” And honestly, some of it is true. AI agents are getting remarkably good at querying data structures that would have required a specialist just two years ago.

So the question is fair. If an AI can navigate Raw Data Vault entities, join Hubs to Links to Satellites, and return a correct answer, what is the Data Vault Engineer actually still doing?

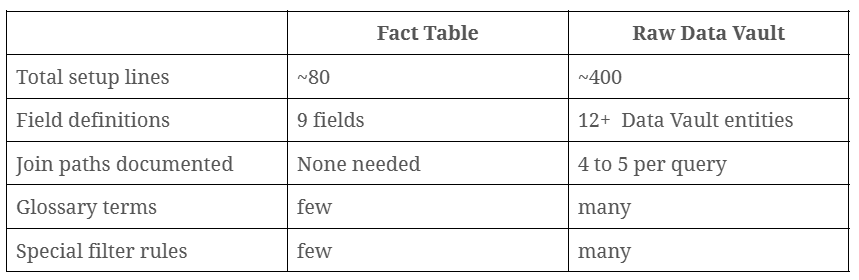
At Scalefree, we decided to stop debating it and start measuring it. Same data, same AI agent, two architectures. A lean 9-column Fact Table on one side. A full 12-table Raw Data Vault on the other. Twenty questions fired at both.

The accuracy result? Equal. The full picture? A lot more interesting.

The Setup Behind the Scores

Both agents were built using Google’s Gemini Data Analytics SDK, a ready-to-use Python toolkit that connects directly to BigQuery and handles the NL2SQL pipeline out of the box. Before either agent could answer a single question though, both needed a detailed set of system instructions. Table descriptions, field definitions, glossary terms, query guidance. And behind every one of those lines is someone who knows the data well enough to describe it accurately. That person does not go away with AI. They become more important.

Here is what that looked like in practice.

AI Fact Table Comparison

The Fact Table instructions fit in one sitting. The Raw Vault required documenting every join path, every satellite filter, and every entity relationship before the agent could reason correctly. That is 5 times more documentation for the exact same end result.

Putting Both to the Test

The test was designed to build up gradually. The first five questions kept it simple: total booking counts, filtering by office location. Then came date and time logic: specific days, monthly ranges, daily breakdowns. The middle tier pushed into duration analysis: average booking lengths, the longest slot, exact minute matches. After that, day-of-week patterns: which weekday is busiest, how Mondays compare. The final five combined everything at once, multi-dimensional queries that needed location, time, and resource type all in a single answer. Here is an excerpt from the final three tiers:

AI Excerpt of the 20-question benchmark test suite

Excerpt of the 20-question benchmark test suite

One deliberate design choice: no personal data. Names and email addresses live in a restricted part of the vault that the agent cannot access. The Fact Table was built to match that boundary from the start. Fair test, clean data governance.

The Results

Honestly? Nobody expected a clean sweep on accuracy. And between us, as Data Vault engineers, we were hoping it would not.

AI Accuracy Comparison Table

Both architectures answered every single question correctly. The AI agent handled a 12-table vault with Hubs, Links, and Satellites just as confidently as a single flat table. That is genuinely impressive, and honestly a little humbling. It also means the modeling and documentation were done right. You cannot score 20 out of 20 on a poorly described structure.

But then look at the last two columns. The Raw Vault took 33 minutes in total to do what the Fact Table did in 6. That is 1.65 minutes per question on average, compared to 0.3 minutes for the Fact Table. Same destination. Five times longer to get there.

What This Means for Your Business

Let’s translate the numbers into business reality.

33 minutes total query time versus 6. That is 1.65 minutes per question on average, compared to 0.3 minutes for the Fact Table. For a business user who just wants a quick answer, that difference is felt immediately. And before any of those queries even ran, the Raw Vault needed around 400 lines of system instructions written by someone who understands the data deeply enough to describe it accurately.

None of this makes the Raw Data Vault the wrong choice. For enterprise data management, it is still the gold standard. But pointing an AI agent directly at it, without a proper semantic layer and without experienced engineers maintaining it, is a fast path to slow answers and frustrated users.

Build the vault. Then build a Fact Table on top of it as the AI-facing layer. That combination gives you the best of both worlds. And it gives your Data Vault Engineer a role that AI cannot fill. Someone has to know the data well enough to describe it. Someone has to model it well enough that the AI can reason with it. That someone is not going away anytime soon.

Key Takeaways

  • Do not judge your AI setup by accuracy alone. Look at query time and setup effort too.
  • A well-modeled Fact Table gives you fast, reliable conversational analytics with minimal overhead.
  • A Raw Data Vault can match that accuracy, but needs 5 times more documentation and runs 5 times slower.
  • Good documentation requires someone who understands the data. AI cannot write that for you, at least not yet.
  • The best architecture for AI analytics is not either/or. Use the vault for data integrity, the Fact Table for the AI layer.
  • Your Data Vault Engineer is not a cost to cut. They are the reason any of this works.

What Comes Next

The full story gets told at our upcoming webinar: Mastering Conversational Analytics: A Practical Guide to Setup, Testing, and Optimization. Live queries. Real failure examples. A practical framework for choosing the right architecture. All of it, with the actual data behind it.

Register here for free

In the meantime, tell us where you are at. Are you working with a Raw Vault, a Fact Table, something else entirely? Drop a comment. We read them all.

How to Use Zapier Copilot to Integrate BigCommerce and Salesforce

Presenter with glasses and a lapel mic explains Copilot; on-screen text reads 'Prompt. Build. Done.' with the Copilot logo in the corner.

How Zapier’s Copilot Is Changing the Way Businesses Automate Workflows

Workflow automation has always promised to save time — but setting up integrations between business systems has traditionally required technical knowledge, careful configuration, and a fair amount of trial and error. That is changing rapidly. Zapier’s Copilot feature, currently in beta, introduces a fundamentally new way to build automated workflows: describe what you want in plain language, and let the AI do the heavy lifting. In this post, we take a close look at how the feature works, walk through a real-world use case involving BigCommerce and Salesforce, and explain why this matters for data-driven businesses looking to move faster without adding technical overhead.


What Is Zapier Copilot?

Zapier Copilot is an AI-assisted workflow builder built directly into the Zapier interface. Instead of manually selecting triggers, actions, and mapping fields one by one, users can simply type a description of the workflow they want to create. The AI interprets the prompt, selects the appropriate apps and actions, maps the relevant data fields, and builds the “Zap” automatically.

The feature currently offers two modes:

  • Auto Mode — The AI builds and tests each step automatically, without asking for confirmation at each stage. This is the fastest way to get a working Zap, and is ideal when working in a sandbox or staging environment where test records being created are not a concern.
  • Ask Mode — The AI pauses before executing each step and asks for confirmation. This mode is recommended when connecting to a production environment, where automatically created test records could cause issues in live data.

This flexibility makes AI Copilot useful for both technical users who want speed and non-technical users who prefer control and transparency throughout the build process.

A Real-World Use Case: BigCommerce Orders into Salesforce

To understand how powerful this feature really is, let us walk through a concrete integration scenario that many e-commerce and sales teams face: synchronizing web shop orders with a CRM.

Imagine a company running its online store on BigCommerce and managing customer relationships and fulfillment in Salesforce. Every time an order is placed on the web shop, the team needs a corresponding record to be created inside Salesforce — specifically in a custom object called Web Shop Order. On top of that, each order contains multiple line items, and those individual products need to be tracked as separate records in a second custom object: Web Shop Order Entry.

Traditionally, setting this up would involve:

  • Manually selecting BigCommerce as the trigger app and configuring the “New Order” event
  • Adding a Salesforce action to create the parent record and mapping each field individually
  • Adding a second loop or action to handle the order line items
  • Testing each step, debugging field mapping errors, and iterating

With AI Copilot, the entire setup begins with a single prompt.

Prompt Engineering for Workflow Automation

The quality of the output from AI Copilot is directly related to the clarity of the input prompt. For this use case, a well-structured prompt might look like this:

“Every time a new order is placed in our BigCommerce web shop, create a new Web Shop Order record in our Salesforce sandbox and also create a Web Shop Order Entry record for each item in the order.”

This single instruction communicates the trigger (new BigCommerce order), the primary action (create a Salesforce record), the specific object (Web Shop Order), and the secondary action (create child records for each line item). The AI picks up on all of these elements and builds the workflow accordingly.

Because the integration should be tested safely, it is best practice to connect to a Salesforce sandbox rather than the production org during the build phase. This prevents test records from polluting live data, and Zapier’s Copilot makes it easy to select the staging environment during the connection step.

What the AI Builds Automatically

Once the prompt is submitted and the connections are authorized, AI Copilot gets to work. Here is what it handles without any manual input:

  • Trigger configuration — It sets up the BigCommerce “New Order” trigger and links it to the connected account.
  • Salesforce record creation — It identifies the correct custom object and adds an action to create a new Web Shop Order record whenever the trigger fires.
  • Automatic field mapping — It maps the relevant order data from BigCommerce to the corresponding fields in Salesforce, including fields required by the object’s configuration.
  • Line item handling — It adds a second action to create Web Shop Order Entry records for each individual product within the order.
  • Testing steps — In Auto Mode, it runs a test of each action and asks for confirmation before proceeding to the next step, ensuring the connection is working before the full Zap is activated.

The result is a finished, tested workflow — in a fraction of the time it would take to configure manually.

Validating the Integration in Salesforce

After the Zap is built and the test is run, the proof is in the data. Switching over to the Salesforce sandbox confirms the result: a new Web Shop Order record has been created, all mapped fields are populated correctly, and the associated order entry records are visible as child records. The integration is live and working.

This kind of immediate validation is crucial in data integration projects. It confirms not just that the connection exists, but that the data is flowing correctly, the right objects are being created, and the business logic is functioning as intended.

Why This Matters for BI and Data-Driven Organizations

For businesses that rely on accurate, real-time data across systems, the ability to quickly build and test integrations has significant implications. A few key takeaways:

  • Reduced dependency on technical resources — Business analysts and operations teams can build integrations themselves, without needing to involve a developer for every new workflow.
  • Faster iteration — AI Copilot dramatically shortens the time between identifying a data gap and solving it. What previously took hours of configuration can now be done in minutes.
  • Lower risk during testing — The sandbox-first approach and Ask Mode give organizations the confidence to test integrations thoroughly before pushing to production.
  • Scalability — Once the base workflow is confirmed, additional fields, conditions, or actions can be layered on top, extending the integration without starting from scratch.

As AI continues to mature within automation platforms, the barrier between a business requirement and a functioning technical solution continues to shrink. Zapier Copilot is an early but compelling example of what this future looks like in practice.

Getting Started

AI Copilot is available directly within the Zapier interface and is currently in beta. To use it, navigate to the Zap builder, look for the AI Copilot option, and start with a clear description of the workflow you want to build. For integrations that involve production systems, always begin with Ask Mode or connect to a sandbox environment first to review each step before it executes.

For organizations dealing with complex multi-system data flows, this feature is worth exploring — and the BigCommerce-to-Salesforce example above is just the beginning of what is possible.

Watch the Video

Close Menu