Mastering Metadata in Data Warehousing
In today’s data-driven world, it is essential to be able to manage and organize large amounts of data in an efficient way. Businesses across all industries are forced to contend with more data than ever before. The introduction and development of an enterprise data warehouse in a company naturally plays a central role, but does not solve a major challenge: How to effectively organize and manage the data, especially metadata, in an Enterprise Data Warehouse? This is where the concept of data catalogs comes into play and where tools like Datahub become essential.
A data catalog serves as a comprehensive inventory of data assets in an organization, providing context, annotations, and metadata to facilitate the understanding and discovery of data. It’s like a map to your data, helping users navigate the complex data landscape to find the exact data they need.
A data catalog can help users to understand where to find specific data in the data warehouse that fits their needs and to investigate where it came from, as well as how it might be connected to other data. This can greatly simplify tasks like data analysis and reporting, making the data warehouse more accessible and usable for everyone in the organization.
Mastering Metadata: Data Catalogs in Data Warehousing with DataHub
Don’t miss our upcoming webinar about data catalogs! This session will explore in detail the critical role of data catalogs in data warehousing, with an exclusive focus on the powerful tool DataHub. You’ll gain practical insights on enhancing data discovery, metadata management, data lineage, and data governance. Sign up today and transform your data management strategies into a competitive advantage.
Understanding Data Catalogs
What is a Data Catalog?
In general, a data catalog is like a metadata inventory, which consists of organized and structured metadata regarding all data assets in an organization. It is a central place where all this metadata can be stored, combined, and categorized, which makes it a lot easier to discover and understand the corresponding data, for example in a data warehouse. A data catalog also has search functionalities to find specific data from the available indexed datasets. It serves like a single source of truth of your metadata, enabling users to trust the data they’re using for their analyses or business decisions.
Role of a Data Catalog in Data Warehousing
In the context of data warehousing, a data catalog brings a lot of benefits. It provides a way to explore and search all data stored in the data warehouse. Technical users, as well as Business Users, can discover relevant data, understand its context, and ensure it is up-to-date, reliable, and accurate. The following figure shows where data catalogs in data warehousing with Data Vault 2.0 take place. A Data Catalog should cover the entire Enterprise BI Solution. This also applies, for example, to a data lake, if available, and to the information delivery layer.

Now that we’ve understood what a data catalog is, let’s delve into how each component plays a part in a data catalog and explore how a tool like DataHub can assist organizations in these tasks.
Introduction to DataHub
In the world of data catalogs, DataHub stands out as an increasingly popular choice for many businesses. DataHub is a growing open-source software developed by LinkedIn to address its growing need for a more dynamic and scalable data management tool. It was created in part due to the fact that the existing tools were not sufficient with LinkedIns expanding needs.
As LinkedIn grew, so did its data volume, variety, and velocity. Recognizing the need for a more efficient way to manage its data, LinkedIn built and introduced DataHub in 2020. Open-sourcing DataHub allowed other organizations to benefit from this advanced tool, and it has since been adopted by many businesses looking for a modern, scalable data catalog solution.
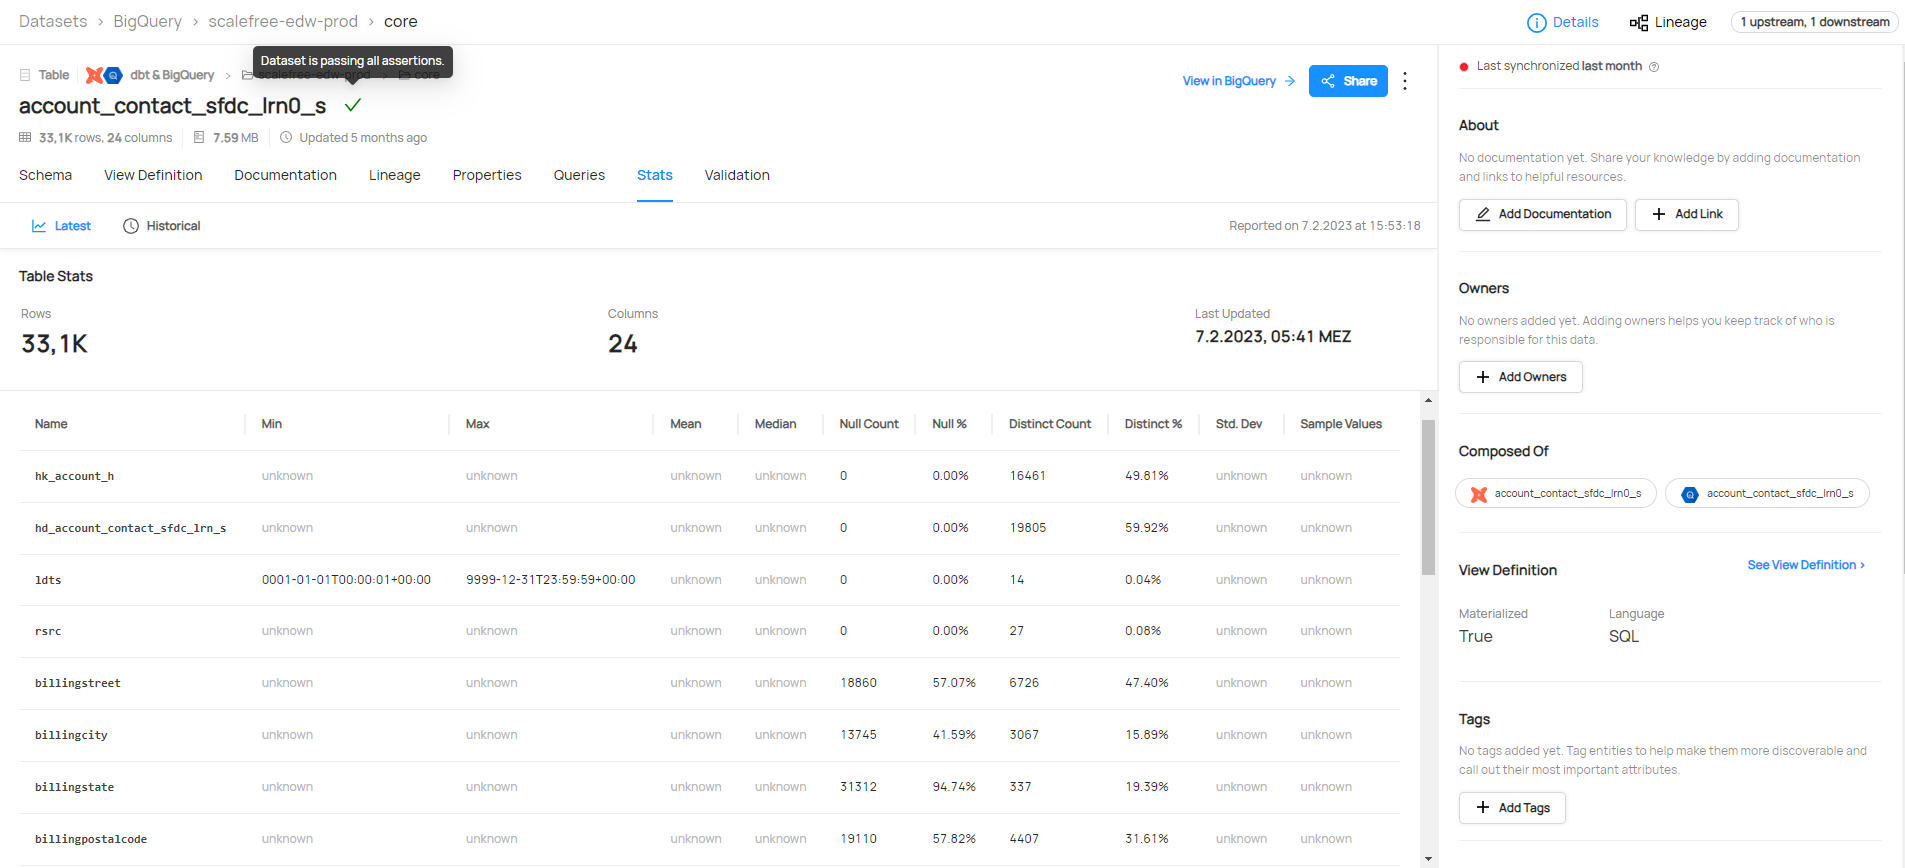
DataHub supports both push-based and pull-based metadata ingestion, including a wide range of integrations for example Airflow, BigQuery, Databricks, dbt, Hive, Kafka, Looker, MSSQL, MongoDB, Oracle, S3, PowerBI, Snowflake, Spark, and much more. You can find a full list here. This gives datahub the ability to combine and show metadata of the same data from multiple sources, for example, a dbt model definition, and if the tests were running successfully, right next to the database schema and stats for all columns.
Key Features and Capabilities of DataHub
DataHub, as a metadata platform, goes beyond traditional data catalogs. DataHub offers all important features and capabilities:
1. Scalability: DataHub is designed to handle metadata from thousands of datasets, which makes it a great choice for large organizations.
2. Flexible and Extensible Data Model: The technical data model behind this tool is designed to be customizable and expandable to allow organizations to customize it to their specific business requirements
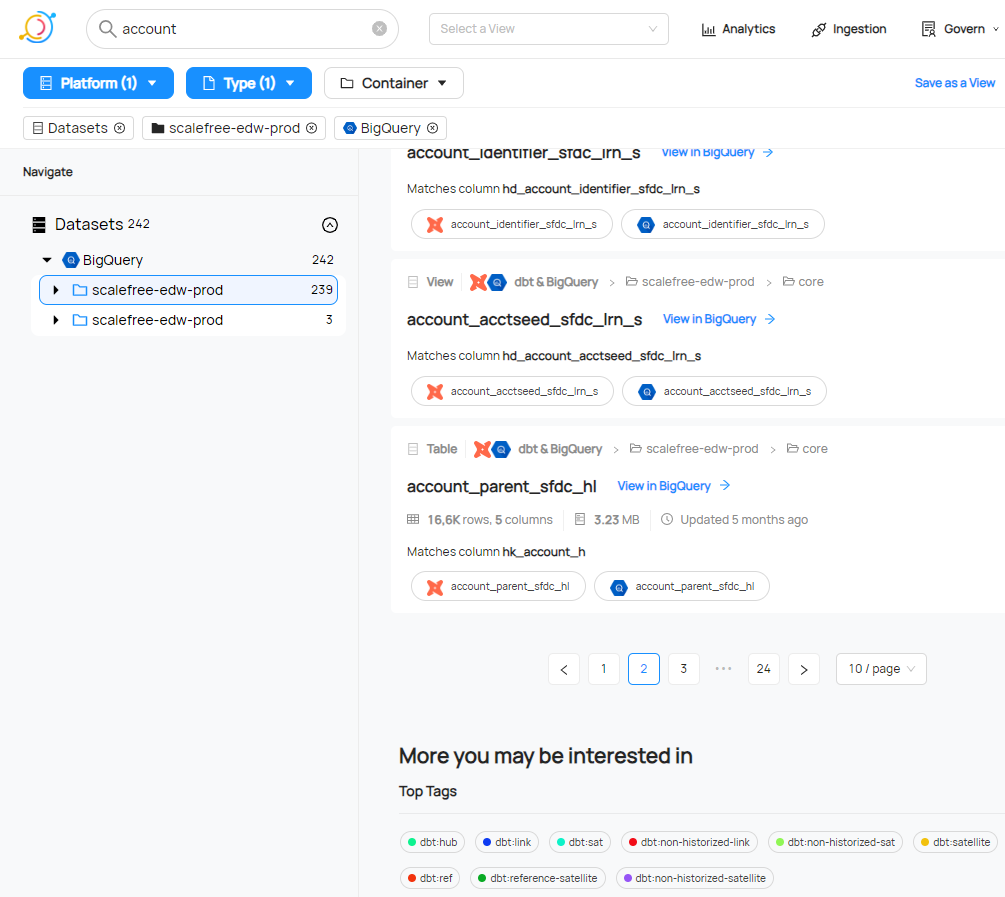
3. Powerful Search and Discovery: Leveraging Elasticsearch, DataHub offers robust search functionality that enables users to discover datasets quickly based on various attributes, such as the data’s origin, schema, and usage.
4. Rich Metadata: Unlike traditional data catalogs, DataHub captures and presents a wide variety of metadata, including data lineage, operational metadata, and business metadata. This gives users a comprehensive understanding of their data.
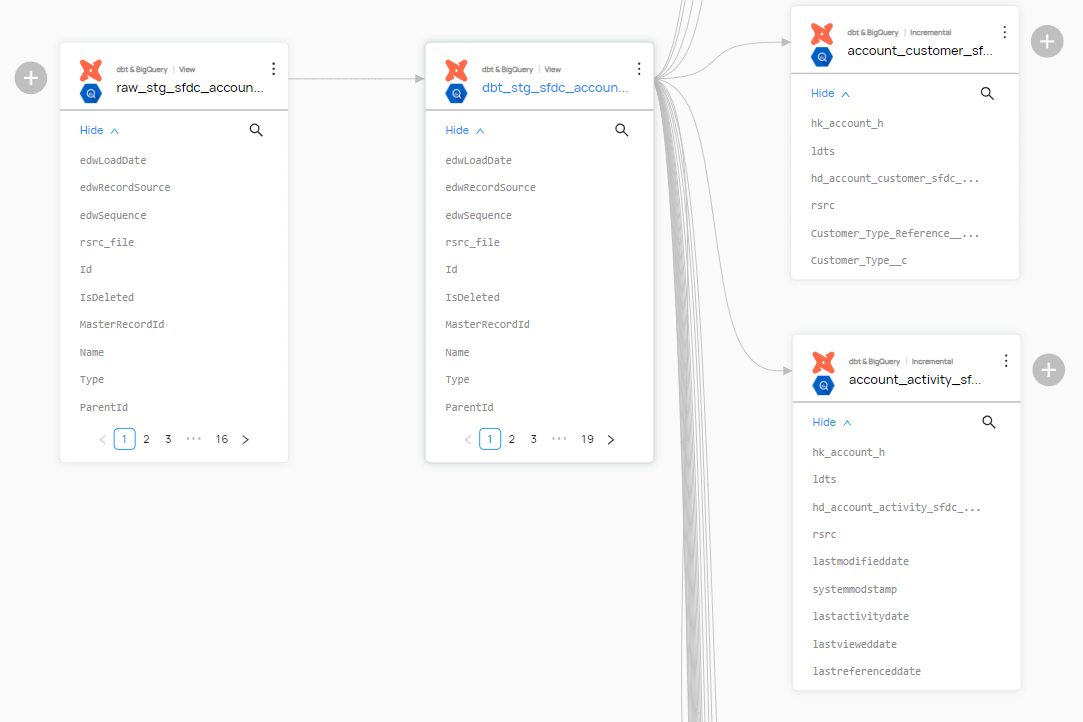
5. Data Lineage and Relationships: DataHub automatically captures and visualizes data lineage, showing how data flows through various systems. It also displays relationships between datasets, allowing users to understand how different data assets interact with each other.
Conclusion
Using a data catalog comes with several benefits:
- Enhanced Data Discovery: With the search and categorization capabilities of a data catalog, users can quickly find the exact data they need without having to comb through large datasets.
- Improved Data Understanding: The metadata in a data catalog provides users with necessary context about the data, making it easier to interpret and use correctly.
- Better Compliance and Governance: A data catalog supports data governance initiatives by ensuring data is consistent, accurate, and compliant with relevant regulations.
- Increased Trust in Data: By providing transparency into data lineage, a data catalog helps build trust in the data by allowing users to see its history and verify its accuracy and reliability.
- Time and Resource Efficiency: By making it easier to locate and understand data, a data catalog can save the company resources, thus speeding up data-driven activities and reducing the burden on data management teams.
In conclusion, DataHub provides a flexible, feature-rich, and all-encompassing option for data catalogs in a data warehousing environment. By providing powerful features for data discovery, metadata management, data lineage, and data governance, it enables businesses to extract maximum value from their data.
If you’re interested in learning more about data catalogs, watch the recording here for free.
– Ole Bause (Scalefree)