search
0

Unlock the Intelligence Layer: LLMs in Data Warehousing and the Future of Your Data

Natural Language AI Model

“Stop writing complex SQL, start talking to your data?”

This provocative question highlights a growing shift in how we interact with data. For years, getting answers from a Data Warehouse meant writing SQL queries or relying on pre-built dashboards.

For many organizations, their data platforms remain underutilized because accessing insights still requires writing code or navigating complex dashboards. It’s time to go beyond static reports and unlock a true intelligence layer on top of your data warehouse. Recent advances in Large Language Models (LLMs) and Natural Language Processing (NLP) are making data warehouses smarter, faster, and easier to use for everyone. In this article, we’ll explore how LLMs can transform the way you interact with your data – from using plain English queries instead of SQL, to AI-driven discovery of hidden insights, to enriching your data pipelines – and why this shift represents the future of data analytics.

Unlock the Intelligence Layer: LLMs in Data Warehousing and the Future of your Data

Unlock your data warehouse’s full potential! This webinar reveals how Large Language Models and Natural Language Processing are transforming data interaction, empowering everyone to effortlessly translate plain language into SQL, enable AI-driven data discovery, and deliver actionable insights to every stakeholder. Register for our free webinar, August 12th, 2025!

Watch Webinar Recording

From Complex SQL to Conversational Queries

Business users often depend on data engineers or analysts to fetch answers, creating bottlenecks in decision-making. Even data professionals themselves spend considerable time writing and optimizing SQL, rather than interpreting results. What if anyone could simply ask the data warehouse a question in plain language and get the answer? This is the promise of LLMs as an “intelligence layer”, a layer that bridges complex datasets and human comprehension. Advanced LLMs can understand a user’s question or request and generate the appropriate SQL queries on the fly.

This technology (often called Text-to-SQL or Natural-Language-to-SQL or NL2SQL) has rapidly evolved and major technology players have already taken note. For example, Databricks introduced a Natural Language Query feature (LakehouseIQ) to let users ask questions of their Lakehouse, and Snowflake is also exploring LLM-driven query capabilities.

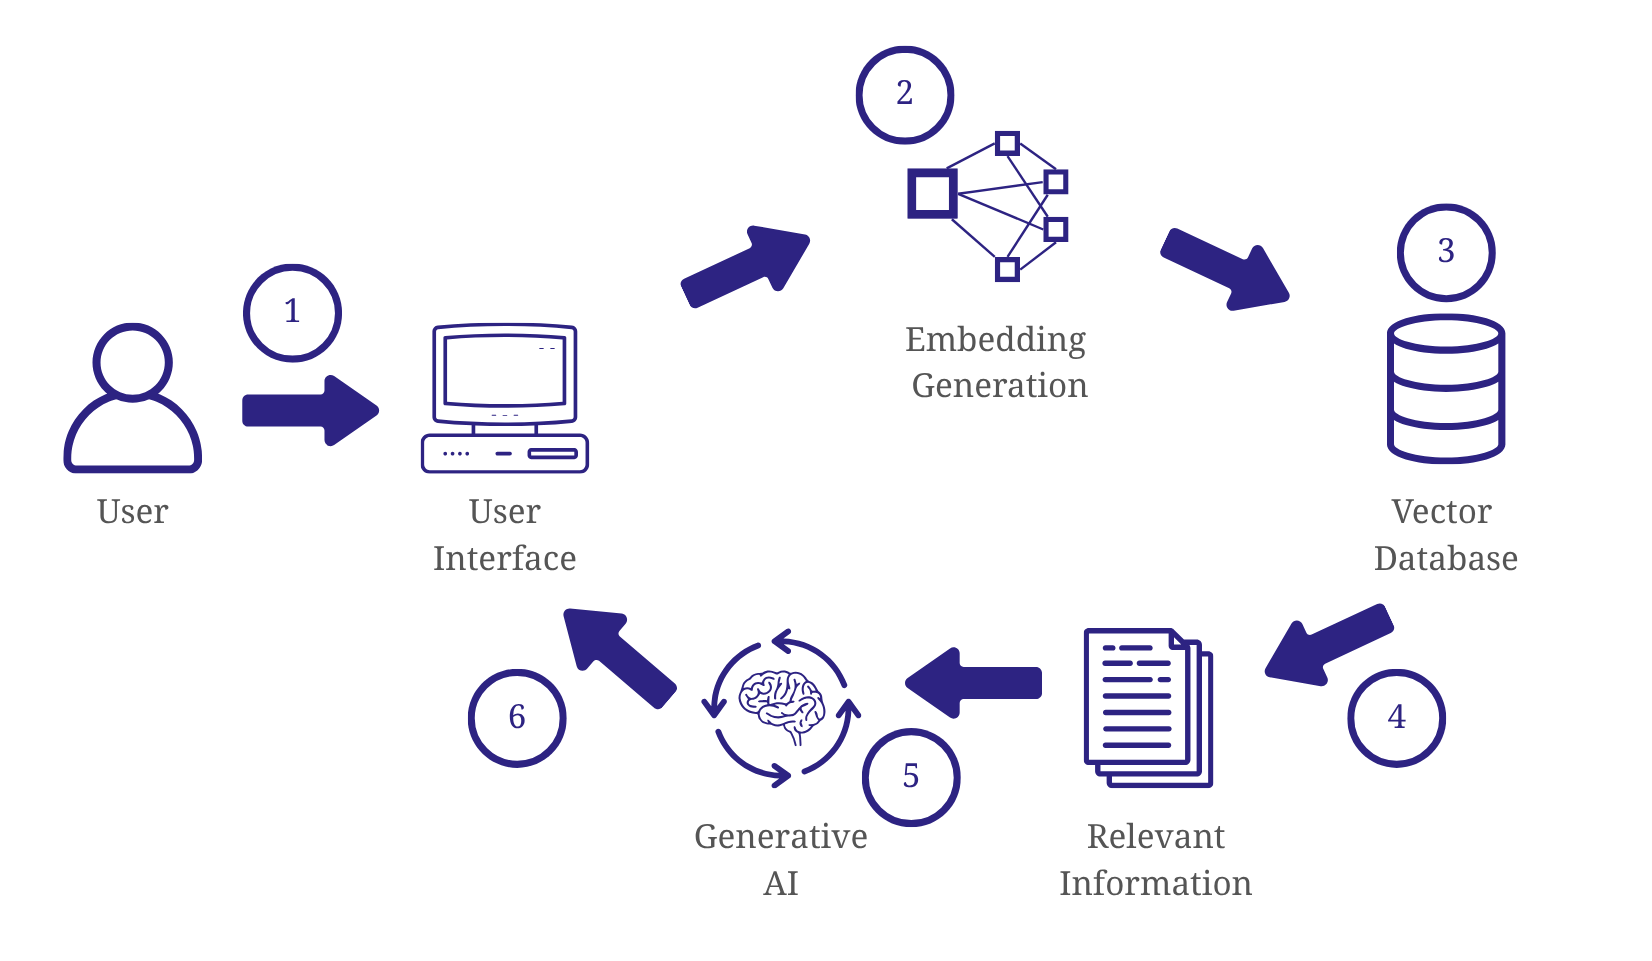
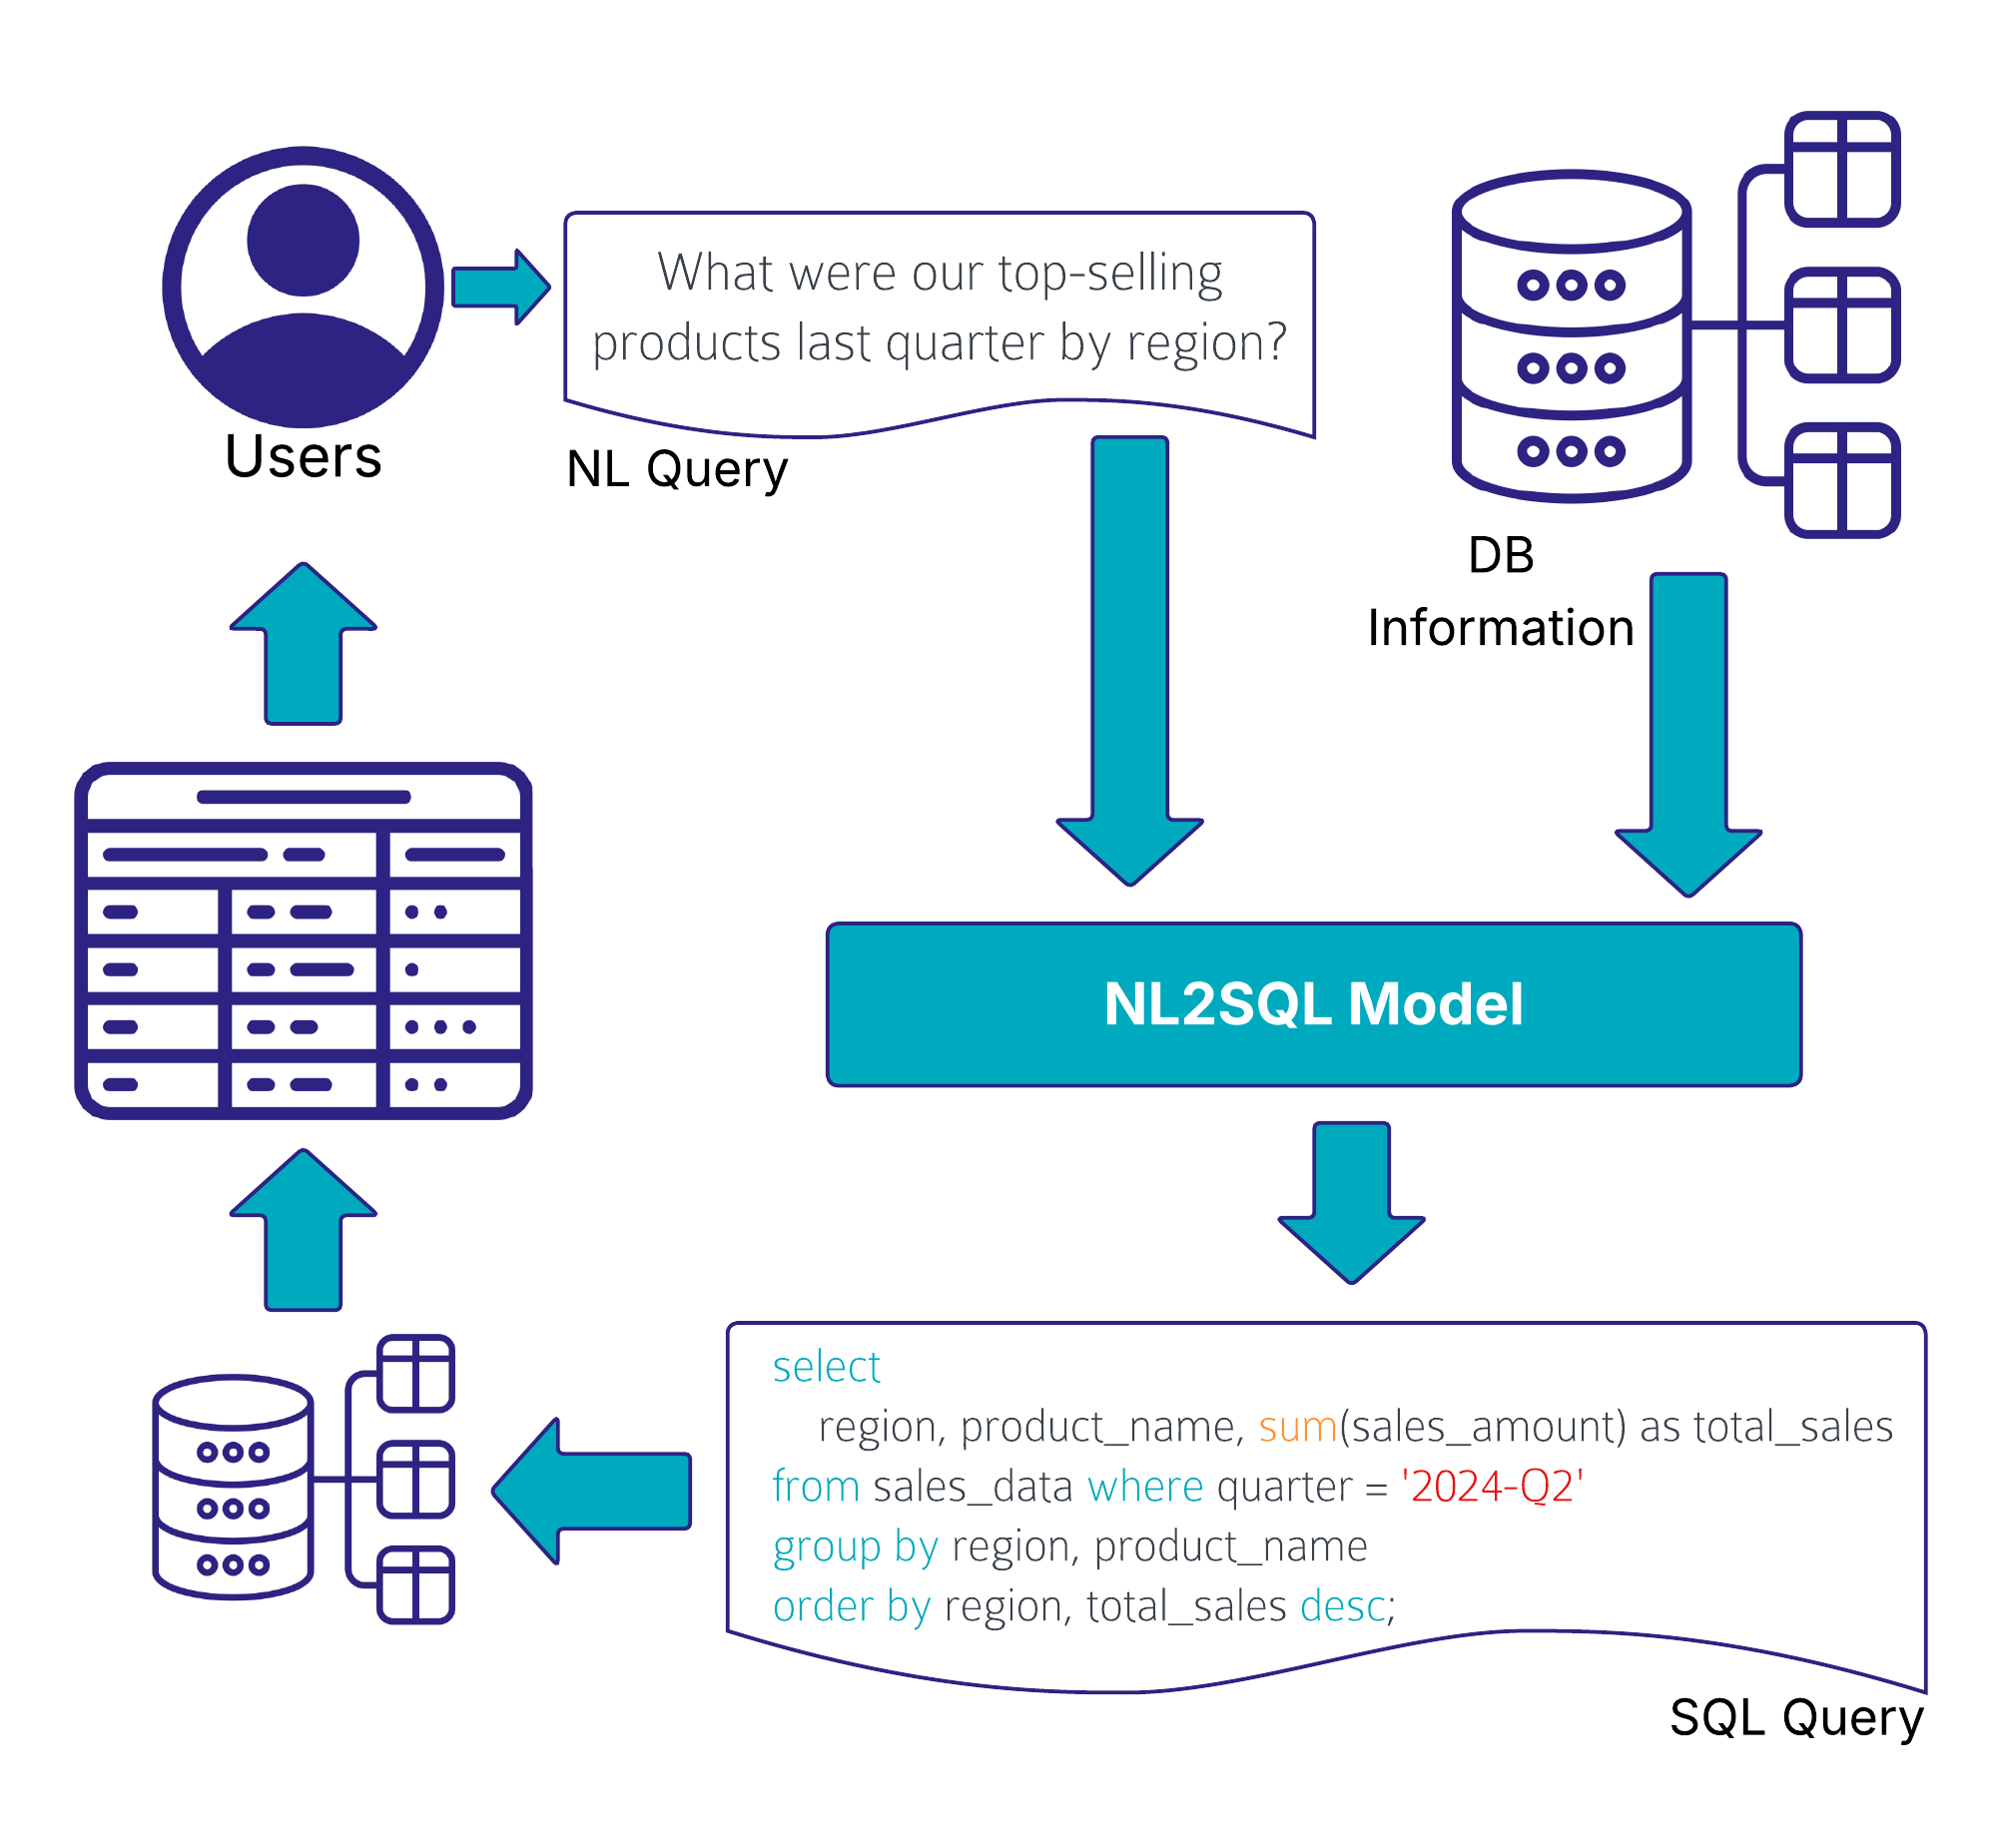
Imagine asking your data warehouse in plain English: “What were our top-selling products last quarter by region?”. This text input is passed into a LLM, often enriched by company-specific data via RAG and then the system translates that into a correct, optimized SQL query that retrieves the answer.

Natural Language AI Model

Of course, translating natural language to SQL at an enterprise scale isn’t trivial. Complex schemas, ambiguous user input, and security considerations mean the LLM has to be both smart and careful. Uber has built such an AI system that works on an enterprise scale level.

Uber’s QueryGPT is an NL2SQL system that uses a multi-step, RAG-based pipeline combining LLMs with retrieval and agent modules. It fetches context via similarity search over a vector database of example queries and schema information for SQL generation. To manage Uber’s vast data ecosystem, QueryGPT employs specialized agents:

  • an Intent Agent classifies requests by business domain
  • a Table Agent suggests tables for the query
  • a Column Prune Agent trims irrelevant columns to reduce prompt length. The LLM then produces the SQL query and an explanation.

This layered design allows QueryGPT to handle large schemas and reliably generate complex multi-table queries. It’s a hybrid architecture where multiple transformer calls specialize in sub-tasks, enabling scalable, accurate NL2SQL as a production service, saving thousands of Uber employees significant time by mid-2024.

AI-Augmented Data Discovery and Insights

Beyond simply fetching results for user queries, LLMs can augment data discovery by revealing insights that users might not have explicitly asked for. Traditional dashboards show you what is happening, but a smart LLM-based system can tell you why it’s happening and highlight patterns you might not notice. This is often called augmented analytics – using AI to automatically find important correlations, trends, outliers, and drivers in your data.

LLMs excel at interpreting data outputs and providing additional context. For example, rather than just displaying a chart or a table, an LLM can generate a written summary pointing out key trends or anomalies. They can explain which metrics are up or down and suggest potential reasons (for instance, detecting that “conversion rates dipped in July, possibly due to seasonality or inventory issues”), enabling quicker and more informed decision-making.

Another area where LLMs can significantly reduce manual effort is in the creation and maintenance of data catalogs. Documenting data models, table structures, and especially individual column descriptions is often time-consuming and easily skipped due to missing resources, despite being crucial for an effective use and accessibility of the data. LLMs can automate large parts of this process by generating descriptions based on data profiling, SQL logic, naming conventions, and metadata.

dbt Cloud has recently released their dbt Copilot AI Agent that supports the developer in various ways, for example by letting the AI analyzing the SQL code and schema metadata to automatically generate model and column descriptions.

LLMs in Your Data Pipeline: Enrichment and Efficiency

LLMs don’t just enhance how users interact with the Data Warehouse; they can also improve the data itself and the efficiency of data engineering processes. In modern ELT (Extract-Load-Transform) pipelines, a lot of time is spent cleaning, enriching, and preparing data for analysis. Here, LLMs offer new tools to automate and augment these steps.

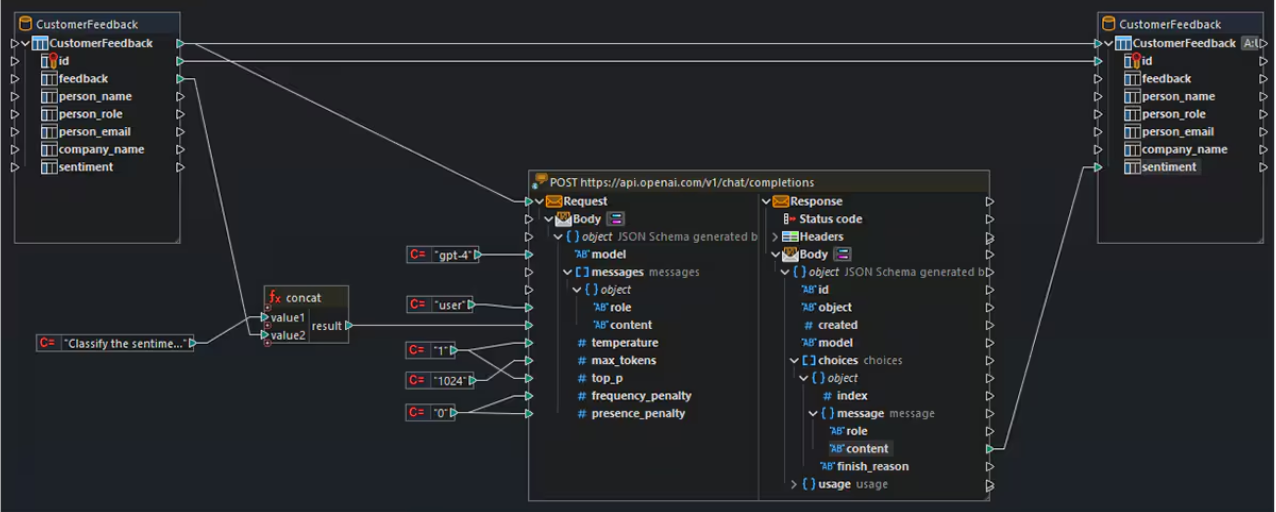
One promising use case is the semantic enrichment of data. Large Language Models have absorbed a vast amount of world knowledge and language patterns, and they can use that to fill gaps or add context to your raw data. For example, imagine you have a dataset of customer feedback where each entry is a text comment. An LLM could automatically classify the sentiment of each comment (positive/negative), extract key themes, or even generate a summary of common issues. In this way, unstructured data becomes structured insights without manual effort. The image below illustrates how an LLM is integrated into a data pipeline: text inputs from a CustomerFeedback table are passed to an OpenAI API endpoint, where the model returns structured sentiment labels that are then stored back in the database.
Large Language Models Sentiment Analysis

In a practical case study, LLMs were used to enrich an academic dataset by inferring missing attributes (like guessing a person’s gender from their name with high accuracy), which outperformed dedicated API services. This showcases how LLMs can bring external knowledge and reasoning to enhance your data.

Another area is metadata enrichment and semantic enrichment of unstructured data. Enterprise data is often filled with cryptic column names and jargon that prevents usability. LLMs can intelligently expand abbreviations and annotate fields with business-friendly descriptions. For instance, an LLM-driven catalog might take a column labeled “CUST_ID” and annotate it as “Customer Identifier, unique ID for each customer record”.

LLMs can also assist in the coding and transformation process itself. Data engineers can leverage LLMs to generate boilerplate code or SQL for transformations, document pipeline logic in plain English, or even detect anomalies and data quality issues through pattern analysis. By automating tedious parts of data preparation and providing AI-generated suggestions, LLMs free up engineers to focus on higher-level architecture and problem-solving.

Conclusion

While the promise of an LLM-powered intelligence layer is exciting, it’s important to approach it with a clear strategy. Successful implementation requires considering a few key challenges and best practices. Data quality and governance are more crucial than ever. If your underlying data is inaccurate or poorly structured, the AI’s answers will be unreliable. As the saying goes, “garbage in, garbage out.”

Ensuring clean, well-organized data (and maintaining a robust data governance program) will help the LLM produce meaningful and correct insights. Additionally, organizations may need to fine-tune or configure their LLMs to understand industry-specific terminology or business context. This reduces the chance of the AI misinterpreting what a user asks or generating an incorrect query.

Privacy and security are another important consideration. If your data includes sensitive information, you must ensure that any AI tool accessing it complies with your security requirements. This might involve using self-hosted models or secure APIs, and setting up proper access controls.

The dream of a self-service analytics experience: “just talk to the data and get answers” is quickly becoming a reality. This evolution may redefine roles (enabling analysts and engineers alike to focus on higher-value tasks) and open up analytics to a wider audience than ever before. It’s an exciting time to be a data professional, but also one that demands staying informed and ready to adapt.


Get Started with dbt: A Quick 15-Minute Guide Using Snowflake

Get Started with dbt Using Snowflake

Introduction to dbt

dbt (data build tool) revolutionizes the way teams build and maintain analytics workflows by bringing software‐engineering best practices to SQL‐based data transformations. Instead of ad‐hoc scripts, dbt encourages version control, modular models, testing, documentation, and lineage graphs. In this guide, you’ll learn how to go from zero to your first dbt models—running entirely in the cloud on Snowflake—in under 15 minutes.


Why Choose dbt Cloud + Snowflake?

  • Fully managed: No local install or complex orchestration; dbt Cloud handles hosting.
  • Quick setup: Snowflake’s partner connector spins up a dbt trial, pre-configured with your credentials.
  • Best practices out of the box: Built-in IDE, job scheduling, Git integration, and documentation.
  • Scalable performance: Leverages Snowflake’s compute power for fast model builds.

Prerequisites

  1. A Snowflake trial account (free, 1-minute setup).
  2. A modern browser (Chrome, Firefox) or VS Code for remote development.
  3. Basic familiarity with SQL.

1. Launching dbt Cloud from Snowflake

Once logged into your Snowflake trial, navigate to the Data Products → Partners → Connect pane. Scroll to find the dbt entry and click Connect → Launch. This will automatically:

  • Provision a dbt Cloud trial account
  • Create a new Snowflake database and warehouse
  • Inject Snowflake credentials into your dbt Cloud connection

You’ll land in the dbt Cloud dashboard, ready to start your first project.

2. Exploring the dbt Cloud UI

In dbt Cloud’s left navigation bar you’ll find:

  • Develop: Interactive IDE for coding models, sources, tests, documentation.
  • Deploy: Job definitions, environments, and run history.
  • Documentation: Auto‐generated docs site with lineage graphs.
  • Settings: Account, project, and Git integration.

Click Develop → IDE (hosted in Chrome or connect your VS Code). Let’s initialize our dbt project.

3. Initializing Your dbt Project

  1. In the IDE, open the Version Control pane and click Initialize dbt Project.
  2. Accept the defaults; dbt creates a dbt_project.yml and folder structure (models/, macros/, etc.).
  3. Commit the auto‐generated files in a new Git branch: “initialized dbt project”.

Your Git pane now shows uncommitted files; click Commit & Push to save the project baseline.

4. Defining Your Source Data

dbt doesn’t load data from external systems—you must point it to existing tables. Snowflake’s sample database (SNOWFLAKE_SAMPLE_DATA) contains TPC-H tables you can use.

Create a new YAML file under models/ named sources.yml with:

version: 2

sources:
  - name: tpch
    database: SNOWFLAKE_SAMPLE_DATA
    schema: TPCH_SF1
    tables:
      - name: CUSTOMER
      - name: ORDERS

Save to see the lineage graph update with two new source nodes.

5. Building a Staging Model

Staging models standardize raw tables and prepare them for downstream transformations. In models/, delete the example/ folder and instead:

  1. Create a folder called models/staging/tpch.
  2. In that folder, create stg_tpch_customer.sql:
{{ config(materialized='view') }}

select
  C_CUSTKEY   as customer_key,
  C_NAME      as customer_name,
  C_ACCTBAL   as account_balance,
  C_COMMENT   as comment
from {{ source('tpch', 'CUSTOMER') }}

Notes:

  • The source() macro resolves to the fully qualified table.
  • materialized='view' tells dbt to build a view by default.

Save and click Run → dbt run to build just this model. In seconds you’ll see a view in your Snowflake UI under the dev schema.

6. Creating a Production-Ready Dimension

Dimensions (Gold layer) contain curated, business-ready tables. Let’s filter for customers with positive balances.

  1. Create models/marts/customer_dim.sql:
{{ config(materialized='table') }}

select
  customer_key,
  customer_name,
  account_balance
from {{ ref('stg_tpch_customer') }}
where account_balance > 0

Here, ref() links to another model, ensuring correct build order and clear lineage.

Click Compile to preview generated SQL, then Run → dbt run to create the table in Snowflake.

7. Testing and Documentation

dbt encourages tests to enforce data quality:

  • Add to models/staging/tpch/schema.yml:
version: 2

models:
  - name: stg_tpch_customer
    tests:
      - not_null:
          column_name: customer_key
      - unique:
          column_name: customer_key

Run dbt test to validate your models. Any failures will be reported in the UI.

Generate documentation with dbt docs generate, then preview via dbt docs serve. Explore your project’s lineage graph and column descriptions.

8. Version Control & Deployment

dbt Cloud integrates Git for collaboration. After feature development:

  1. Commit your branch and open a pull request (GitHub, GitLab, Bitbucket).
  2. Merge into main.

In Deploy → Environments, create a production environment. Under Jobs, define a job that runs:

  • dbt seed (if you have local CSV seeds)
  • dbt run
  • dbt test

Schedule the job (e.g., hourly, daily) or trigger it on Git commits. Monitor run history and logs directly in dbt Cloud.

9. Best Practices & Next Steps

  • Modularize models: Break complex logic into smaller models.
  • Document extensively: Use YAML descriptions for sources, models, and columns.
  • Implement CI/CD: Integrate dbt Cloud jobs with your team’s CI pipeline.
  • Leverage analyses: Create analyses/ for ad-hoc queries and charts.
  • Scale with packages: Reuse community packages (e.g., dbt_utils).

For deeper dives, explore the official dbt documentation and the dbt Hub for community packages and best practices.

Watch the Video

Conclusion

In just a few steps, you’ve:

  • Provisioned dbt Cloud via Snowflake
  • Initialized a dbt project with Git
  • Defined raw sources and built staging models
  • Created a production dimension with ref()
  • Tested data quality and generated documentation
  • Set up a CI/CD job for automated deployment

Now you have a repeatable, maintainable analytics pipeline. Keep building new models, add tests, and document as you go—your future self (and team!) will thank you.

Pre-Joining Data Vault Business Keys During Load

Data Vault Business Keys

Data Vault architects often encounter a common challenge when their source systems mix surrogate technical IDs with true business keys. In one real-world scenario, an Employee table used a technical ID as its primary key, while the legitimate business identifier was NBR. Downstream tables—even a self-referencing manager hierarchy—used that ID as a foreign key. When building Hubs on both ID and NBR and linking them with a Same-As Link, the result resembles a Source Vault design—and it quickly becomes unwieldy to repeat ID→NBR lookups for every referencing table.

In this article, we’ll explore the best practice for handling mismatched keys: pre-joining business keys in your staging (or view) layer before loading the Raw Data Vault. You’ll learn why this denormalization is fully compliant with Data Vault principles, how to implement it (even with CDC feeds), and when you might need alternate approaches.


Why Separate Business Keys from Technical IDs?

Surrogate keys (ID) offer stable integer references, simple indexing, and isolation from business rule changes. But they aren’t meaningful outside the operational schema. True business keys (NBR)—like employee numbers, order numbers, or product SKUs—carry real-world meaning and ensure consistency across downstream BI and analytics models.

  • Business Key (NBR): Immutable identifier used in reporting, cross-system integration, and audit.
  • Technical ID (ID): Auto-generated surrogate for OLTP performance and referential integrity.

When you build a Hub on the business key, all Links and Satellites must reference that same key. Mixing in surrogate IDs without conversion violates business lineage and forces repetitive lookups.

The Pitfall: Source Vault by Accident

Faced with source tables referencing ID, some teams create:

  1. A Hub on ID (surrogate),
  2. A Hub on NBR (business key),
  3. A Same-As Link between them to tie ID↔NBR.

This “Source Vault” pattern captures technical IDs as though they were business keys—contradicting the principle that your Vault’s integration key must be a shared business identifier. Moreover, every time you load any Link or Satellite that uses ID, you must look up NBR via the Same-As Link. Tedious, error-prone, and defeating the agility of your Data Vault.

Best Practice: Pre-Join Business Keys in Staging

Data Vault training explicitly allows you to reshape your staging area—denormalizing or normalizing source data to simplify Raw Vault loads. Pre-joining means: before your load process begins, enrich every source record with the true business key (NBR) rather than the surrogate ID. You then feed the Hub/Satellite/Link loaders with business keys directly—no Same-As Link gymnastics required.

How It Works

  1. Create a view or staging query that joins your Employee table (on ID) to itself or to the hierarchy table to retrieve NBR. Add the NBR field into every downstream staging record.
  2. Use that pre-joined staging view as the source for your Data Vault loaders. All Hubs, Links, and Satellites can now reference NBR consistently.
  3. Drop the accidental Hub on ID and Same-As Link—your Vault only contains the true business key Hub (Hub_Employee on NBR).

This approach turns the repeated lookup problem into a one-time denormalization, improving performance and maintainability.

Tool Support: dbt & FlowBI

Modern Data Vault toolkits recognize this pattern:

  • datavault4dbt package: Offers a pre_join feature to automatically enrich staging tables with business keys.
  • FlowBI: Includes configuration options to map surrogate IDs to business keys before Vault loads.

When your staging area resides on a cloud data lake (e.g., AWS S3 + Redshift Spectrum, Azure Data Lake + Synapse), these tools can reference external tables and materialize pre-joined views seamlessly.

Handling CDC & Empty Deltas with Forward Lookup

Change Data Capture (CDC) introduces a nuance: sometimes the Employee record doesn’t change (NBR remains the same), but the hierarchy table (manager assignment) does. A pure inner-join staging view would omit the hierarchy change because no new employee row appeared.

Forward Lookup Pattern

  1. When your CDC batch contains only hierarchy changes, load your staging view with the ID column but no accompanying NBR.
  2. Instead of joining to the source Employee table (which has no new row), perform a forward lookup against the target Satellite in your Raw Vault. That Satellite already stores every historic mapping of ID→NBR.
  3. Retrieve the latest NBR value for each ID and inject it into your staging records—just as if you had joined to the source.

This assumes your CDC infrastructure and initial loads correctly populated the Satellite. If CDC reliability is questionable, you may need to capture ID first and resolve to NBR later in a Business Vault layer.

Caveats: Pre-Join Within a Single Source Only

While you can (and should) pre-join within one source system, avoid chaining pre-joins across multiple systems. If you first wait for System A’s staging load to produce NBR from its ID, and then join System B’s staging to A’s data, you introduce cross-system load dependencies. That forces you to serialize loads—waiting for one system’s batch to finish before you can process another.

To maintain parallel ingestion, each source should be pre-joined only to its own business keys. If two systems share a business key, let that intersection happen downstream in your Vault (via Hub on the shared business key), not in the staging layer.

When You Can’t Pre-Join: Source Vault as Last Resort

In rare environments where you cannot reliably pre-join—legacy databases with locked-down permissions or untrustworthy CDC—you may fall back to a Source Vault. In this design:

  • Your Hubs use surrogate ID as the primary key (capturing the technical ID).
  • You defer mapping to true business keys into the Business Vault layer, after all sources land.

Source Vaults make sense only when staging denormalization is impossible. Otherwise, they sacrifice business clarity for expedience.

Step-By-Step Implementation Guide

  1. Identify Business Keys: Catalog each table’s true business key(s)—not the surrogate PKs.
  2. Build Staging Views: For each source, create a view that LEFT JOINs the “owner” table back to itself (or to its lookup tables) to pull in NBR wherever ID appears.
  3. Validate Keys: Ensure every staging record includes a non-null business key. Flag or quarantine any orphans (IDs without known business key).
  4. Configure Load Scripts: Point your Vault loaders (Hubs, Links, Satellites) at these staging views. Remove any loaders that target surrogate key Hubs or Same-As Links.
  5. Implement Forward Lookup: For CDC batches that may omit source changes, add a fallback join to the Employee Satellite in your load script to fetch the last known NBR for each ID.

Benefits of Pre-Joining Business Keys

  • Simplicity: One denormalization step replaces dozens of repetitive lookups.
  • Performance: Staging views optimize key enrichment in set-based SQL rather than row-by-row Link loads.
  • Lineage: Your Raw Vault contains only true business keys, preserving clear end-to-end lineage.
  • Maintainability: Future source schemas that reference ID get mapped automatically via the shared staging view logic.

Conclusion

Mismatched surrogate and business keys need not derail your Data Vault design. By embracing pre-joining business keys in your staging layer—along with forward lookups for CDC edge cases—you preserve a clean, business-centric Vault model without cumbersome Same-As Links. Reserve Source Vaults only for environments where staging denormalization simply cannot occur. With these best practices, your Vault remains performant, transparent, and aligned with true business identifiers.

Watch the Video

10 Essential Skills Your Team Needs to Build an Analytical Data Platform

Analytical data platform team meeting

Build an Analytical Data Platform

Building a modern analytical data platform is more than just choosing the right database or ETL tool. It requires a blend of business insight, data expertise, architecture design, and automation savvy. In this article, we’ll explore ten essential skills your team needs to design, develop, and maintain a robust, scalable, and high-value data platform.


1. Business Understanding

Before diving into any technical work, your team must understand the business domain and the data itself. This doesn’t mean every engineer needs to be a data analyst, but they should know:

  • Which source systems hold the data (CRM, ERP, marketing platforms, etc.)
  • Key business objects (customers, contracts, opportunities) and how they relate
  • Business processes behind the data, like a customer’s lifecycle or sales funnel

By grounding the team in real-world outcomes—such as improving customer retention or reducing churn—engineers stay focused on delivering measurable ROI.

2. Objective Setting & ROI Focus

Clear objectives guide every stage of your platform’s development. Whether your goal is to accelerate financial reporting or enable real-time marketing analytics, defining the desired outcomes:

  • Helps prioritize features and data sources
  • Aligns stakeholders around common metrics
  • Boosts motivation by tying work to tangible business value

Teams that regularly track ROI milestones can adjust scope and resources proactively, ensuring the platform grows in step with organizational goals.

3. Data Understanding & Modeling

A deep dive into your source systems reveals hundreds—even thousands—of tables. Your engineers need to know:

  • Primary and foreign keys connecting entities
  • Relationship cardinalities (one-to-one, one-to-many, many-to-many)
  • Data quality quirks and domain-specific rules

This understanding informs the modeling approach—be it third normal form, star schemas, or Data Vault—ensuring downstream analytics are consistent and reliable.

4. Data Acquisition Techniques

Extracting data from source systems can take many forms:

  • Full daily extracts via CSV or JSON files
  • API calls for near-real-time data feeds
  • Change Data Capture (CDC) for incremental updates

Knowing when to use each approach minimizes data latency, reduces load times, and optimizes storage. CDC, in particular, slashes the volume of data transferred, but requires robust handling to maintain consistency.

5. Structured Architecture: The Medallion Approach

Dumping raw data into a single database is a recipe for chaos. Instead, adopt a layered “medallion” architecture:

  • Bronze Layer (Staging/Landing): Raw data as ingested
  • Silver Layer (Cleansed, Integrated): Unified and harmonized data across systems
  • Gold Layer (Presentation): Curated tables/views for business users and BI tools
Medallion Architecture in an analytical data platform

This separation of concerns simplifies debugging, improves performance, and clarifies responsibilities for each team member.

6. Data Integration & Modeling in the Silver Layer

The silver layer is where the “magic” happens:

  • Integrating disparate systems into a unified view
  • Applying your chosen modeling technique (e.g., star schema, Data Vault)
  • Ensuring referential integrity and consistent business definitions

Investing in a proven modeling framework not only scales with additional data sources but also enables automation and accelerates the onboarding of new subject areas.

7. Temporality & Historical Tracking

Beyond technical timestamps (extract load times), your data has business timelines:

  • Contract start/end dates
  • Customer sign-up and churn events
  • Promotion or campaign effective periods

Implementing snapshot tables, slowly changing dimensions, or time-aware modeling ensures accurate trend analysis, historical comparisons, and auditability.

8. Code Generation & Automation Tools

Hand-coding every pipeline is time-consuming and error-prone. Leverage tools that:

  • Automatically generate ETL/ELT code based on templates
  • Orchestrate complex workflows and dependencies
  • Enforce consistency through standard patterns and conventions

Automation not only speeds up development but also improves data quality by reducing manual interventions.

9. Agile Development & Traceability

Adopting an agile mindset means delivering small, working increments quickly. Apply traceability by:

  • Defining clear targets (e.g., monthly revenue report)
  • Mapping those targets back to specific source tables
  • Focusing on data that directly supports your objectives

This approach prevents “scope creep” and ensures that every pipeline built serves an immediate analytical need.

10. DevOps & Cost Management

Once pipelines are automated, you need:

  • Orchestration frameworks (e.g., Airflow, Dagster) to schedule and monitor jobs
  • CI/CD for data code, including version control and automated testing
  • Cost monitoring tools to track cloud resource usage and optimize performance

Effective DevOps practices guarantee reliability, while cost-awareness keeps your platform sustainable in the cloud era.

  • Data Profiling: DataHub continuously monitors and analyzes data quality, automatically generating profiling metrics that reveal data distributions, identify anomalies, and help maintain high data quality standards. It provides key statistics such as row and column counts, query frequency, top users, and last update timestamps, along with detailed attribute profiling, including value ranges, central tendencies, null and distinct values. The table below shows some examples of these profiling metrics.

Watch the Video

Conclusion

Building an analytical data platform is a multifaceted endeavor. By equipping your team with these ten skills—spanning business understanding, data modeling, architecture design, automation, and DevOps—you’ll lay the foundation for a platform that delivers consistent insights, scales gracefully, and drives real business value.

How to Sell Data Vault to Management

How to Sell Data Vault

Convincing senior executives to invest in a robust data architecture like Data Vault can feel like scaling a fortress gate. You know the technical merits inside out, but managers care about business outcomes, budgets, and timelines—not hash keys, hubs, and satellites. In this article, we’ll explore how to “sell” Data Vault to C-level stakeholders by focusing on the features and value it delivers, rather than its underlying technical mechanics.


The Danger of Technical Jargon

When building a house, a homeowner asks, “How many bedrooms? How many bathrooms? What’s the square footage?” They don’t delve into whether the builder used nails or screws. Likewise, executives don’t care if you use Data Vault, Kimball, or Inmon. They care about the end product: reliable reports, faster insights, and lower risk.

Starting a conversation with “Let me explain our Hub-and-Satellite architecture…” alienates non-technical stakeholders. Instead, frame your pitch around business capabilities and measurable outcomes.

Reframe the Conversation: It’s a Data Platform, Not a Methodology

Ask yourself: what does management really want? The answer is simple:

  • Governed, compliant data for audits and regulations
  • Fast, accurate reporting to inform decisions
  • Scalable infrastructure that grows with your business
  • Ability to integrate new sources—legacy systems, real-time feeds, and unstructured data
  • Future-proof automation and AI-driven efficiency

Position your solution as an enterprise data platform that delivers these capabilities. Only dive into Data Vault specifics when a technical stakeholder asks—then you can explain how its modular design underpins agility and auditability.

Key Business Benefits to Highlight

Below are the core value propositions you should emphasize. Each maps directly to executive priorities:

1. Integrate Any Source, Any Format

– Combine data from ERP, CRM, cloud services, IoT streams, social feeds, and Excel sheets.
– Handle conflicting or incomplete data without losing lineage.
– Accelerate time-to-insight by onboarding new sources in days, not months.

2. Auditability & Compliance

– Capture full history of every data change for regulations (GDPR, SOX, HIPAA).
– Reconstruct past reports exactly as they were delivered.
– Demonstrate data lineage and provenance to satisfy auditors and regulators.

3. Automation & Developer Productivity

– Use off-the-shelf tools (FlowBI, automation frameworks) to generate 70–80% of your pipelines code.
– Reduce manual coding errors with template-driven scaffolding.
– Free your team to focus on business logic and analytics, not plumbing.

4. Scalable Performance & Flexibility

– Scale out compute and storage independently in the cloud (AWS, Azure, Google).
– Handle spikes in data volume—batch or streaming—without re-architecting.
– Support thousands of concurrent users and complex analytics workloads.

5. Multiple Business Perspectives

– Deliver different “versions of the truth” side-by-side: sales view, finance view, marketing view.
– Maintain consistent business rules and definitions across departments.
– Enable self-service BI without sacrificing governance.

Positioning Your Pitch

Armed with these benefits, craft a narrative that aligns with your organization’s strategic goals:

  • Cost Avoidance: Showcase how auditability and automation reduce remediation costs and manual reconciliation.
  • Risk Mitigation: Emphasize regulated data lineage, reducing compliance fines and reputational damage.
  • Business Agility: Illustrate faster source onboarding to support new products, M&A, and market pivots.
  • Developer Efficiency: Quantify hours saved through code generation and reusable templates.

Handling Common Objections

“We don’t want to invest in fundamentals anymore.”

Many firms chase “silver bullet” tools—data lakes, LLMs, or generic ETL appliances—hoping to skip architecture. Explain that without a solid foundation, new tools amplify chaos, not clarity. Draw parallels: no builder skips the foundation to save budget.

“Isn’t this too complicated?”

Compare Data Vault to modular construction: pre-fabricated components assembled with repeatable processes. Complexity is hidden under the hood; what management sees is a predictable, standardized delivery pipeline.

“We already have a data lake/warehouse.”

Acknowledge existing investments. Then demonstrate: Data Vault can sit atop or alongside current environments, enhancing governability and enabling phased migration without rip-and-replace.

Engaging Different Stakeholders

Each audience has different concerns. Tailor your message accordingly:

  • CEO/COO: Focus on revenue growth, operational efficiency, and risk reduction.
  • CFO: Highlight cost avoidance, predictable budgeting through reusable components, and audit compliance.
  • CTO/CIO: Dive into scalability, cloud economics, and integration patterns.
  • Business Unit Leaders: Emphasize faster delivery of insights, tailored dashboards, and self-service BI.

Real-World Success Stories

Nothing beats concrete examples. Present case studies or internal pilots that showcase:

  • 50% reduction in data onboarding time for a new source system.
  • 30% decrease in remediation tickets due to automated auditing.
  • Consistent reporting across finance and marketing, eliminating “version conflict” meetings.

Roadmap & Phasing

Break the project into manageable phases:

  1. Pilot Phase: Integrate one or two critical sources, deliver dashboards in 4–6 weeks.
  2. Expansion Phase: Add additional systems, build out automation and governance playbooks.
  3. Optimization Phase: Operationalize PIT tables, refine performance, onboard self-service users.
  4. Continuous Evolution: Incorporate AI-driven code generation and new data sources as needed.

Phased delivery reduces risk and allows management to see progressive value, reinforcing buy-in for subsequent investments.

Conclusion

Selling Data Vault to management isn’t about cold, technical lectures on hash keys and satellites. It’s about painting a vivid picture of what the organization will achieve: faster insights, iron-clad audit trails, automated pipelines, and a flexible, scalable data platform that grows with the business. Speak their language—doors, windows, and square footage—then build your foundation behind the scenes.

Watch the Video

Data Lineage: Mapping Data Flows for Decisions and Compliance

What About Data Lineage?

In today’s data-driven organizations, ensuring trust, transparency, and compliance in data usage is more crucial than ever. A foundational component that enables these outcomes is data lineage mapping. It provides a visual and logical understanding of data’s journey — from its origin in source systems through various transformations to its final destination in dashboards and reports.

In this article, we’ll explore what data lineage is, why it matters for modern data teams, and how to implement it effectively using both manual and automated approaches. Whether you’re just beginning or optimizing your governance strategy, this guide will help you start small, scale smart, and deliver value early.


What is Data Lineage?

Data lineage is the process of tracking and visualizing the lifecycle of data as it moves through systems, transformations, and uses. It maps how data flows from source to destination — including every stage it touches along the way, such as staging areas, data warehouses, and reports.

For example, in a typical setup, customer data might originate in a CRM system, move through ETL pipelines into a cloud data warehouse, and end up in a business intelligence report. Data lineage helps answer: Where did this data come from? What transformations were applied? Which systems and people interacted with it?

Why Data Lineage Matters

  • Compliance and Regulation: Many regulations like GDPR and HIPAA require data traceability. Having data lineage helps organizations meet legal obligations by showing how personal or sensitive data is handled.
  • Trust and Transparency: Business users gain confidence in the reports they rely on when they can understand the data’s origin and the processes behind it.
  • Impact Analysis: With a clear lineage, you can instantly identify which reports or models are affected by changes in source systems or logic.
  • Improved Decision-Making: Accurate, well-understood data leads to better business decisions and more effective use of data products.
  • Strategic Enablement: As more people understand your data ecosystem, collaboration improves, and innovation becomes more achievable.

Simple Example of Data Lineage

Let’s break down a basic data lineage flow:

  1. Source: A CRM system collects new customer data.
  2. Processing: ETL processes extract the data and load it into a cloud data warehouse (e.g., Snowflake).
  3. Transformation: Business rules are applied in staging or modeling layers using tools like dbt.
  4. Output: The processed data is visualized in a reporting dashboard (e.g., a compliance report named CS-3239).

Each of these steps can and should be documented and tracked in your data lineage tool or framework. This becomes essential when something breaks, or compliance auditors ask for data traceability.

Capturing Data Lineage: Manual vs. Automated

Manual Mapping

In the early stages, manual mapping is a valuable exercise. Use tools like Excel, Visio, or Lucidchart to map one high-impact report end-to-end. Identify where the data comes from, how it’s transformed, and where it’s consumed. This approach is resource-intensive and doesn’t scale, but it’s a powerful first step for:

  • Understanding your data landscape
  • Validating with data owners and stewards
  • Testing your understanding before committing to tooling

Automated Tools

For scalable implementation, automated data lineage tools are essential. Options include:

  • Datahub
  • Collibra
  • Informatica
  • Microsoft Purview
  • OpenLineage

These tools automatically gather metadata from your systems and visualize data flows. However, automation still requires configuration, integration, and validation. No tool does it all out of the box.

Best Practice: Integrate your data lineage with your business glossary and data catalog. This creates a connected governance ecosystem, where clicking on a data object reveals lineage, definitions, and ownership.

Quick Wins to Get Started

Here’s a practical, proven strategy to build momentum:

  1. Start Small: Identify one critical report or dataset that is heavily used or often misunderstood.
  2. Map Manually: Trace its data lineage from source to consumption. Focus on transformations and logic.
  3. Validate: Work with data owners, analysts, and engineers to validate the map.
  4. Test Tooling: Use this one case to evaluate lineage tools. Compare ease of integration, visibility, and automation.
  5. Integrate: Tie lineage into your broader governance structure — glossary, catalog, ownership, and quality.

This approach helps you avoid “big bang” governance failures. Starting with a focused win builds trust and demonstrates value to other teams.

Common Pitfalls to Avoid

  • Overengineering: Avoid making your first project too large. Focus on delivering a working example fast.
  • Ignoring Technical Setup: Before choosing a tool, check with your engineering teams. They may already be using dbt or similar tools that support lineage.
  • Lack of Collaboration: Governance is a team sport. Include data stewards, engineers, analysts, and business users.

Key Takeaways

  • Data lineage provides control and clarity over your data landscape, enabling better decisions and easier compliance.
  • Start small and iterate. One validated report lineage is worth more than 10 unfinished diagrams.
  • Work cross-functionally. Involve both governance and technical stakeholders early in the process.
  • Leverage what you already have. Tools like dbt, Snowflake, and BI platforms may already offer lineage features.
  • Choose tools carefully. Test with real examples before rolling out across the organization.

Final Thoughts

Data lineage mapping is no longer a luxury — it’s a necessity for organizations that aim to be data-driven, compliant, and transparent. Whether you’re leading a governance initiative or optimizing data operations, understanding your data’s journey is the foundation of success.

If you’re interested in a more detailed session on tooling or implementation strategies, feel free to reach out via LinkedIn or the contact form. Let’s bring visibility and trust into your data ecosystem.

Watch the Video

Green Bond Reporting in Record Time at Grenke AG

Green Bond Reporting

Sustainability and transparency have long been more than just buzzwords – nowadays, they are part of how modern companies see themselves. Green bonds are becoming increasingly important as they enable targeted investments in sustainable projects. Professional and audit-proof reporting is crucial to create trust among investors, auditors, and other stakeholders.

Our client Grenke, had already relied on our expertise and implemented a data warehouse based on Data Vault 2.0. The processes were largely automated so that data sources could be integrated and processed efficiently. When a new requirement for green bond reporting arose, we were able to implement it in just one month, thanks to the already existing scalable setup.

Initial Situation: An Existing, Automated Data Warehouse

  • Data Vault 2.0 as a foundation:
    Grenke was already using a robust Data Vault 2.0 architecture that enables flexible and expandable data storage thanks to its clear structures (hubs, links and satellites).
  • Automated model generation:
    By using templates and metadata-driven approaches, data vault models can be generated automatically. This reduces manual effort, increases standardization and improves data quality.
  • Quality checks and audit compliance:
    Plausibility checks, historization and metadata-supported processes already ensured high data quality and traceability – essential for audits and reporting.

These prerequisites formed the perfect springboard for quickly and reliably integrating the new Green Bond Reporting into the existing system.

New Requirement: Green Bond Reporting

With this new requirement, Grenke was faced with the challenge of collecting and preparing and presenting specific ESG key figures and green bond-specific data in a comprehensible report.

The aim was to design the reporting in such a way that:

External reviewers and auditors can gain insight quickly and easily.

Investors and other stakeholders receive transparent information about the sustainable projects.

Regulatory requirements and internal standards are met at all times and documented in a comprehensible manner.

Thanks to the existing Data Vault 2.0 infrastructure and the high level of automation, it was possible to implement these new requirements in a short space of time.

Our Approach: Expansion Instead Of New Construction

  1. Requirements analysis
    Together with Grenke, we defined the relevant green bond key figures and reporting requirements. These included classifications according to ESG criteria, assignment of project types, as well as regional and financial attributes.
  2. Integration into the existing data warehouse
    Instead of building a new system, we added the required fields to the existing hubs, links and satellites. Thanks to the agile Data Vault 2.0 methodology, this was possible without much additional effort.
  3. Automated processes and quality checks
    Thanks to the existing ETL/ELT routes, we were able to quickly and securely load the data into the system. New validation rules for green bond reporting were added to ensure that all relevant data was recorded completely and correctly.
  4. Reporting & dashboards
    Based on the processed data, we have developed interactive dashboards and reports that clearly present the project status, the scope of financing, and other ESG key figures. External auditors can also be given access via export functions if required.
  5. Rapid approval through external audits
    As the Data Vault 2.0 structure ensures complete historization and traceability of the data, the external audits ran smoothly. The auditors were able to fully trace all steps and data changes – a decisive advantage for sustainability reports.

Result: Green Bond Reporting In Just One Month

The combination of a scalable Data Vault 2.0 approach, a high level of automation, and an already established data infrastructure enabled us to successfully deliver the Green Bond Reporting in just one month.

This means:

  • Fast time-to-market: Grenke was able to publish the report quickly and go straight into communication and marketing.
  • Trustworthy database: Thanks to integrated quality checks and traceability, the reporting is audit-proof – a crucial prerequisite for external audits.
  • Future-proof solution: New key figures, extended ESG criteria, or regulatory requirements can be flexibly integrated without having to fundamentally rebuild the system.

What Grenke Says

“Partnering with Scalefree has been instrumental in our Data Vault 2.0 journey. Their deep expertise in Data Vault principles and practical dbt know-how have significantly supported our implementation, ensuring a smooth and structured process. Thanks to their guidance, we’ve already improved our ability to integrate and analyze business data while building a scalable and future-proof data warehouse.”

Oliwia Borecka
Chief Data & Analytics Officer at grenke digital GmbH

Conclusion: Agile And Sustainable Into The Future

The project shows how Scalefree supports customers in quickly and efficiently integrating new requirements into existing data ecosystems. The Data Vault 2.0 approach provides the ideal basis for this: scalability, flexibility, and revision security ensure that companies can meet their reporting requirements not only today, but also tomorrow.

Would you like to find out more about how you can future-proof your data warehouse or ESG reporting?
Contact us at Scalefree – together we will develop a customized solution that meets your requirements and puts you in the best possible position in terms of sustainability and transparency. We look forward to making your project a success!

The Important Role of Data Catalogs in Modern Data Warehousing: A Practical Look at Datahub

Data Catalog Architecture

Data Catalogs in Modern Data Warehousing

Modern data architectures are becoming increasingly complex, posing significant challenges for organizations. Data is often scattered across multiple systems, making it difficult to locate, utilize, and preserve its quality. Analysts spend a substantial amount of time searching for relevant information, while businesses struggle to manage data efficiently and comply with regulatory requirements. A structured approach to metadata management is essential to enhance transparency, maintain data quality, and enable efficient data usage.

This article is aimed at data professionals, business users, and IT teams looking to establish or improve structured metadata management. It explores the challenges of fragmented metadata, the role of data catalogs as a central solution, and how they enhance data organization and usability. Additionally, it provides practical insights into structuring a data catalog within a Data Vault 2.0 architecture to support a scalable and comprehensive data strategy.

The Challenge of Fragmented Metadata

In the era of data-driven decision-making, organizations face a fundamental challenge: fragmented and inconsistent metadata. Across different departments, heterogeneous systems, divergent naming conventions, and varying documentation standards lead to a disjointed data landscape. Analysts and data professionals often spend excessive time locating, verifying, and interpreting data—a process that not only reduces efficiency but also increases the risk of errors and misinterpretations.

At the core of this issue lies the absence of a centralized metadata repository. Without a unified source of truth, critical aspects such as data lineage, ownership, and quality remain unclear. This lack of transparency not only complicates regulatory compliance but also erodes trust in data and impedes strategic initiatives. The result is the formation of data silos that prevent organizations from fully leveraging their data assets. As highlighted, this fragmentation leads to wasted time and effort on finding and accessing data, turns data platforms into data swamps, and hinders the development of a common business vocabulary.

What is a Data Catalog?

A data catalog is a centralized, structured repository that organizes and manages metadata across an organization, facilitating efficient data discovery, governance, and collaboration. Much like a well-curated library, a data catalog enables users to locate, understand, and utilize data efficiently by capturing essential metadata and making it easily searchable and accessible. Beyond merely indexing data assets, a data catalog provides critical context, tracks relationships between datasets, and integrates user-driven insights to enhance data usability and governance.

Features of a Data Catalog

A well-implemented data catalog consists of several foundational features that support metadata management, data governance, and user collaboration:

  • Metadata Management: Captures and organizes essential information about datasets, such as source, format, relationships, and usage patterns, ensuring accessibility and usability.
  • Data Discovery: Enables users to locate and access data quickly through intuitive search functions that leverage metadata attributes and contextual tags.
  • Data Lineage: Tracks the lifecycle of data, mapping its journey from origin to consumption. This allows organizations to trace transformations, ensuring data integrity and error resolution.
  • Data Governance: Establishes policies for data availability, usability, integrity, and security. This can include access control, regulatory compliance, and stewardship responsibilities.
  • Business Glossary: Defines business terminology and ensures consistency across the organization, improving communication and reducing misinterpretation of data fields.
  • Data Dictionary: Provides technical documentation on data structures, including schema definitions, data types, and field constraints.
  • Data Profiling: Analyzes datasets to generate statistics on data quality, completeness, distribution, and anomalies. This helps organizations understand their data better and ensures its reliability for analytical and operational use.

Benefits of a Data Catalog

A data catalog enhances data discovery by providing structured metadata, enabling users to efficiently find and access the right datasets. By offering clear definitions, contextual information, and lineage tracking, it improves data comprehension, ensuring that users understand data origins, transformations, and relationships.

Discovering and understanding data sources and their use is a core function of a data catalog. Business users can quickly locate relevant datasets, evaluate their fit, and utilize them effectively. Additionally, users can contribute to the catalog by tagging, documenting, and annotating data sources, fostering collective knowledge and enhancing data usability.

It fosters trust by documenting data quality, provenance, and usage, ensuring that users rely on accurate, well-maintained datasets. Furthermore, by reducing redundancy and streamlining workflows, a data catalog increases operational efficiency, saving time and resources while maximizing the value of an organization’s data assets.

How a Data Catalog Works

A data catalog functions as a dynamic metadata management system, automating the extraction, organization, and indexing of metadata. It seamlessly connects to various data sources, including data platforms, data lakes, ETL pipelines, and BI tools, synchronizing metadata through two primary approaches: pull-based and push-based ingestion.

In the pull-based approach, the data catalog actively queries source systems using APIs, JDBC connectors, or scheduled scans to retrieve metadata. This method allows the catalog to regularly update its metadata repository by fetching information from the source systems. On the other hand, the push-based approach relies on source systems to send real-time metadata updates to the catalog through event-driven mechanisms, webhooks, or message queues. This ensures immediate synchronization of metadata, keeping the catalog up-to-date with any changes in the data landscape.

Once metadata is ingested, the data catalog standardizes and enriches it, ensuring consistency and adding valuable context. This process includes extracting schema details, identifying data ownership, applying classifications, and establishing data lineage. The standardized and enriched metadata is then stored in an indexed repository, enabling fast search, filtering, and lineage tracking. Furthermore, automated tagging, schema change detection, and governance policies are implemented to ensure compliance with security and regulatory requirements.

Integrating a Data Catalog With Data Vault 2.0

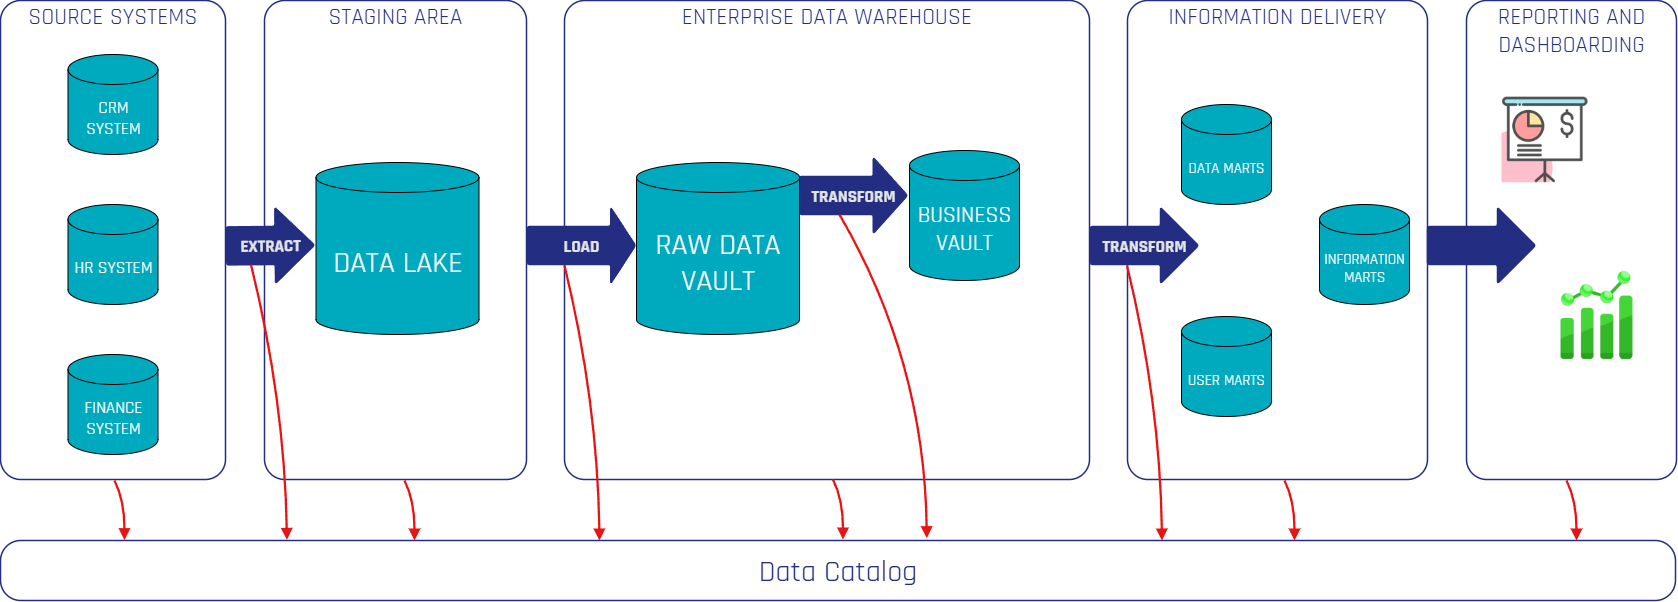
The diagram illustrates how a Data Catalog integrates into a Data Vault 2.0 Architecture. Using various connectors, it extracts metadata from source systems, data platforms, ETL tools, and BI tools through push- or pull-based approaches. The red arrows represent the flow of metadata from these systems into the Data Catalog, ensuring continuous capture and synchronization of metadata. This process guarantees end-to-end visibility, governance, and accessibility, making data assets more reliable and valuable for business users and analysts.

Data Catalog Architecture

Organizations can choose between open-source and commercial solutions. Commercial platforms like Atlan, Alation, and Collibra offer fully managed enterprise solutions with automation and vendor support, while open-source tools such as DataHub, Amundsen, and OpenMetadata provide more customizability and cost efficiency. Many open-source solutions now also offer cloud-based enterprise versions for easier deployment.

Self-hosted deployments are typically hosted on Docker or Kubernetes, giving organizations greater control and security, making them ideal for compliance-heavy environments. Meanwhile, cloud-based solutions offer automatic scaling and lower maintenance overhead, simplifying operations.

A well-integrated Data Catalog should connect seamlessly with data sources, ingest metadata efficiently, and provide structured management and governance. In a Data Vault 2.0 environment, it enhances traceability and transparency, enabling better data-driven decisions and reducing inefficiencies caused by fragmented metadata.

Introduction to DataHub

In this section, we will present an example of a data catalog tool and some of its key features.
DataHub is a leading open-source data catalog developed by LinkedIn to address the challenges of data discovery, governance, and observability in complex data ecosystems. Designed to handle the increasing volume, variety, and velocity of data, DataHub has been adopted by numerous organizations seeking to improve their metadata management practices. It supports both push- and pull-based metadata ingestion, seamlessly integrating with a wide range of data tools and technologies, including dbt, Snowflake, BigQuery, and Airflow.

Key Features of DataHub

DataHub goes beyond the traditional features and benefits of a standard data catalog by offering advanced features that address modern data management challenges. Here are some practical insights on how DataHub solves some of the features of a data catalog:

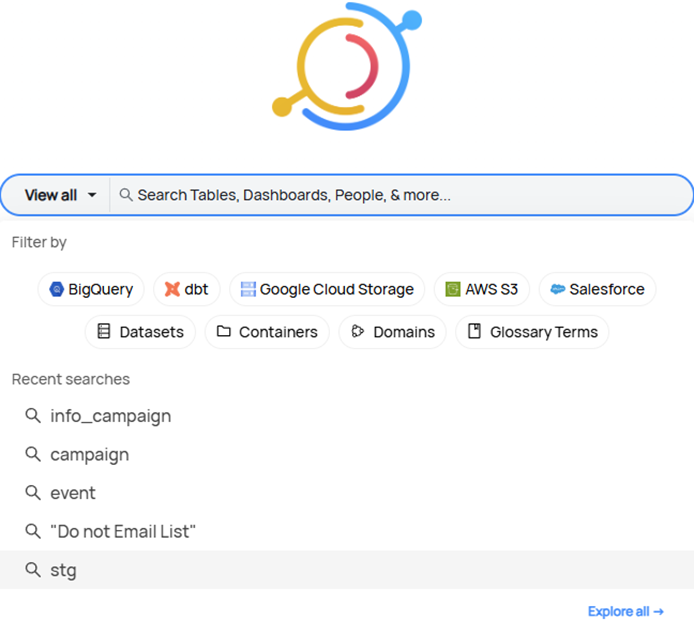
  • Data Discovery: Leveraging advanced search capabilities and detailed metadata, DataHub enables users to quickly locate and understand data assets, facilitating efficient data-driven decision-making across the organization, with a powerful search and filtering mechanism that allows users to refine queries by platform, domain, data type, owner, and specific tags, significantly enhancing the search process.
Internal Data Catalog Screenshot 1

Screenshot of Internal Data Catalog

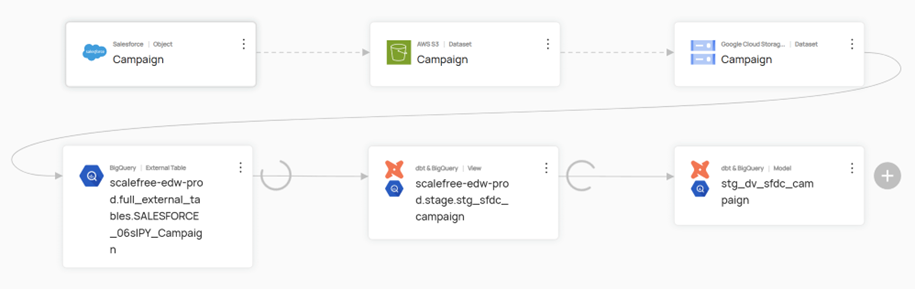
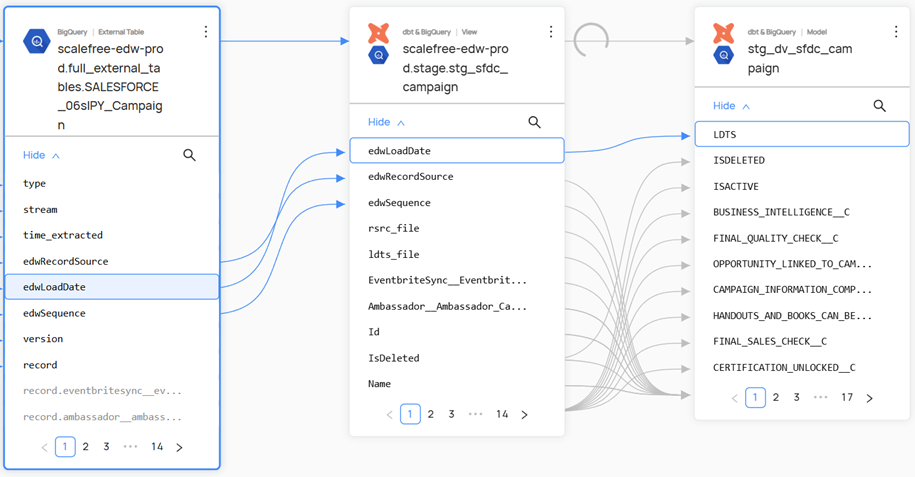
  • Data Lineage: It provides a comprehensive, visual trace of data flow—from origin through various transformations to final consumption—ensuring transparency, simplifying troubleshooting, and supporting compliance efforts. This lineage can extend down to the column level, offering a granular view of how data is transformed and utilized throughout the system.
Internal Data Catalog Screenshot 2
Internal Data Catalog Screenshot 3

Screenshot of Internal Data Catalog

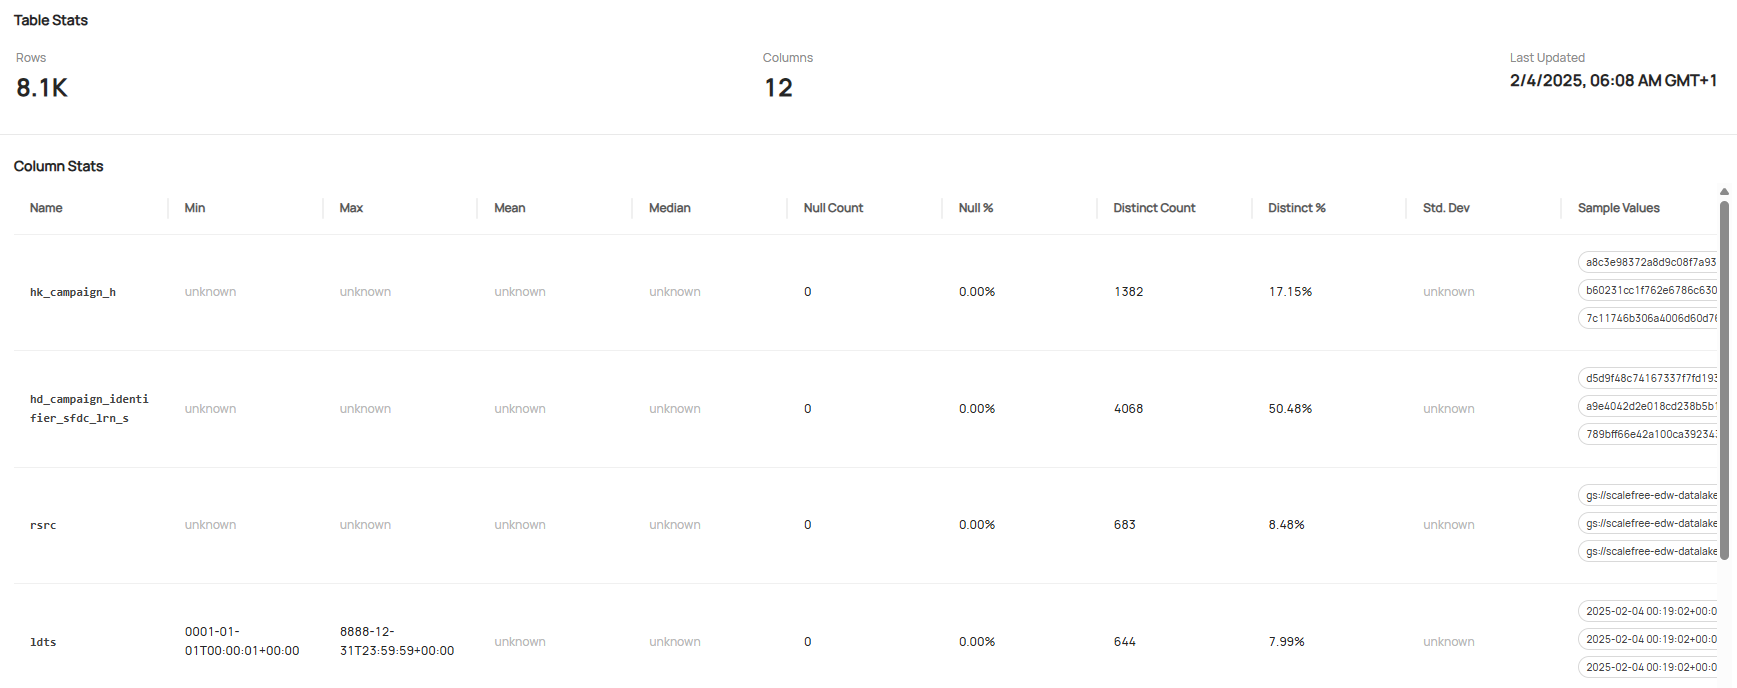
  • Data Profiling: DataHub continuously monitors and analyzes data quality, automatically generating profiling metrics that reveal data distributions, identify anomalies, and help maintain high data quality standards. It provides key statistics such as row and column counts, query frequency, top users, and last update timestamps, along with detailed attribute profiling, including value ranges, central tendencies, null and distinct values. The table below shows some examples of these profiling metrics.
Internal Data Catalog Screenshot 4

Screenshot of Internal Data Catalog

Watch the Video

Conclusion

In an era where data volume and complexity continue to surge, a robust data catalog is no longer optional, it is essential. By centralizing and enriching metadata, catalogs like DataHub turn fragmented datasets into a coherent, trustworthy foundation for analytics, governance, and collaboration. Implemented alongside architectures such as Data Vault, they deliver the transparency, lineage, and quality controls that modern organizations need to unlock real value from their data, quickly, confidently, and at scale.

When to Use Reference Tables in Data Vault?

Reference Tables in Data Vault

In modern Data Vault 2.0 implementations, teams often face a recurring question: “We have dozens of small, static lookup tables—should we model them as full Hubs and Satellites, or can we use simpler reference tables?” If you’re dealing with Excel sheets containing tens or hundreds of rows of relatively stable data (like Profit Centers, Status Codes, or Region mappings), this article will help you decide when a lightweight reference table suffices—and when you need the auditability of a Hub/Satellite pattern.


Understanding Business Data vs. Reference Data

First, it helps to distinguish two broad categories of data:

  • Business Objects: Entities that your processes create and update constantly—Customers, Orders, Products, etc. You generate new keys and change descriptive attributes frequently.
  • Reference Data: Code lists and lookup tables that describe or classify business objects—Country codes, Profit Center codes, Contract types. These change infrequently and usually in small batches.

Although some tables can straddle the line (e.g., Profit Centers may be “business objects” for accounting teams), it’s often safe to treat truly stable code lists as reference data for modeling purposes.

Simple Reference Tables: Pros and Cons

A simple reference table in your Data Vault is nothing more than a flat table with:

  • Primary Key: Your reference code (e.g., profit_center_code).
  • Attributes: The 2–5 descriptive columns you need (e.g., profit_center_name, region).
  • No History: Only the current state is stored; updates overwrite existing rows.

Advantages: Easy to implement, minimal objects, straightforward joins at query time.
Disadvantages: No built-in historical tracking—updates will retroactively change past reports, and you cannot reconstruct previous descriptions.

When Simple Reference Tables Are Appropriate

Consider a flat reference table when:

  • Your business requirement only needs the latest values.
  • Updates are extremely rare (quarterly or less) and don’t require audit trails.
  • Performance of lookups is not mission-critical (small table sizes).
  • You have no regulatory or internal need to reproduce past descriptions.

If any of these criteria fail—especially auditability—then a simple reference table can become a liability.

Introducing Reference Hubs and Reference Satellites

To combine simplicity with history, use the Reference Hub & Reference Satellite pattern. This mirrors the standard Hub/Satellite design, but optimized for code lists:

  • Reference Hub:
    • business_key: the code (e.g., PROFCTR_001)
    • record_source: data origin
    • load_date: date the code list was loaded
  • Reference Satellite:
    • business_key (FK to Hub)
    • load_date (also part of PK)
    • Descriptive attributes (e.g., name, region, valid_from)

This approach captures every change to your reference data without overwriting, and still keeps your model lightweight.

How It Works in Practice

  1. Load the Hub: Insert every code once (or refresh if new codes appear).
  2. Load the Satellite: For each code, insert a new row whenever any descriptive attribute changes, tagging it with the load_date.
  3. Querying: In your dimension or Information Delivery layer, join from your business object Satellite (or Link) directly into the Reference Satellite on code, filtering to the row with the latest load_date ≤ transaction date.

Because reference tables are small, these joins remain performant even when you compare on dates.

Aligning Reference Data with Business Vault Snapshots

For organizations using a Business Vault layer with snapshot dates, you may need to “time-align” reference data. Two patterns are common:

  • On-the-fly alignment: In your reporting view, use the transaction’s snapshot_date and join to the Reference Satellite where load_date ≤ snapshot_date, picking the latest record.
  • PIT/Bridge tables: Precompute “Point-In-Time” (PIT) tables that store the reference code’s surrogate key aligned to each business object snapshot for faster querying.

Choose the pattern that balances your performance SLAs with data freshness requirements.

Auditability and Regulatory Compliance

If you operate in regulated industries (banking, telecom, government), audit trails are mandatory. The Reference Hub/Satellite pattern ensures:

  • Complete lineage and history of every code change.
  • Reproducibility of past reports with original reference descriptions.
  • Ability to support retrospective analyses without reloading or reconstructing data.

Even if your initial business users only ask for current values, future sprints or stakeholders may require historical context—so building auditability upfront can save costly refactoring.

Performance Considerations

Reference tables typically contain at most hundreds of rows. However, you should still consider:

  • Indexing: Ensure load_date and business_key are indexed for fast lookups.
  • Partitioning: Generally unnecessary for small tables but useful if your Satellite grows into thousands of deltas over years.
  • Join Strategy: In most SQL engines, joining a large transaction Satellite to a small Reference Satellite on code + latest date filter is efficient. If not, consider a PIT table.

Governance and Knowledge Transfer

Whatever pattern you choose, document and govern your reference data:

  • Maintain an authoritative data dictionary describing each code list, source, update frequency, and steward.
  • Set up automated tests (e.g., CI/CD validations) to detect unexpected code changes.
  • Implement alerts for large volumes of reference updates that may indicate data quality issues.

Decision Checklist

Use this quick checklist when evaluating a table for reference modeling:

  1. Is the table truly static or slow-changing? (Quarterly or less)
  2. Are there audit or historical requirements? (Regulatory or future use cases)
  3. Is the table small enough (< 1,000 rows) to avoid performance concerns?
  4. Do you need to reconstruct past reports with original descriptions?
  5. Would a simple change in the future (e.g., retro-active update) break historical reports if you used a flat table?

If you answered “yes” to questions 2 or 5, the Reference Hub/Satellite pattern is the safer choice. Otherwise, a simple reference table may be sufficient.

Conclusion

Static lookup tables in a Data Vault 2.0 implementation can be modeled either as simple reference tables or with a Reference Hub & Satellite pattern. While flat tables are easier to build, they lack historical tracking and auditability. By adopting the Reference Hub/Satellite approach, you gain full change history, reproducible reporting, and alignment with regulatory demands—while retaining a lightweight design.

Use the decision checklist above to guide your modeling choices, and ensure your Data Vault remains both agile and compliant as your organization’s needs evolve.

Watch the Video

Outsourcing the Data Warehouse: Finding the Right Balance

Outsourcing the Data Warehouse

In today’s data-driven world, building and maintaining a robust data warehouse is a critical strategic initiative. As organizations grow and their data complexity increases, leaders often ask: Is there a way to third-party some of the data warehouse work and infrastructure? In other words, can you “outsource the data warehouse” without jeopardizing control, security, or long-term knowledge retention?


Why Treat Your Data Warehouse as Strategic

Most organizations—especially those generating significant revenue or handling complex data flows—view their data platform as a core strategic asset. It underpins reporting, analytics, and decision-making, and drives competitive advantage. Handing over this critical function entirely to an external provider can feel like giving away the keys to your business.

  • Control & Governance: Keeping the data warehouse in-house ensures direct oversight of data quality, security, and compliance.
  • Knowledge Retention: Your internal team develops deep institutional understanding of data models, business logic, and reporting requirements.
  • Strategic Flexibility: Internal ownership allows you to pivot rapidly as business needs evolve, without waiting on external roadmaps or SLAs.

The Role of External Expertise

That said, nearly every successful data warehouse project benefits from external consulting, especially in the early stages. Consultants bring:

  • Proven Frameworks: Templates, best practices, and reference architectures refined across multiple clients.
  • Jump-Start Momentum: Hands-on help with infrastructure setup, project governance, and team organization.
  • Skill Gap Coverage: Experienced data architects, engineers, and DevOps specialists to fill temporary talent shortages.

Once your internal team is up to speed, you can scale back external support—keeping consultants focused on specific areas where they provide the most value.

Outsourcing Infrastructure: The Cloud Advantage

For many organizations, the first form of “outsourcing” is the data center itself. On-premises servers have given way to cloud platforms like AWS, Google Cloud, and Azure. By migrating your data warehouse infrastructure to the cloud, you:

  • Reduce Capital Expense: No more large upfront hardware purchases or data center maintenance costs.
  • Gain Elastic Scalability: Spin up additional compute and storage on demand to handle peaks in data processing.
  • Enhance Security & Reliability: Leverage the cloud provider’s certifications, redundancy, and disaster recovery capabilities.

This shift effectively delegates infrastructure work—provisioning, patching, and physical security—to a trusted third party, while you retain control of your data and processes.

Balancing Internal and External DevOps

DevOps for your data platform—CI/CD pipelines, automated testing, and deployment orchestration—can also be partially outsourced. However, it’s important to strike the right balance:

  • Internal DevOps Leads: Core pipeline design, approval processes, and environment governance should remain with your in-house team.
  • External Specialists: Consultants can set up complex workflows, integrate tools, and train your staff on best practices.
  • Limit External Proportion: Aim to keep no more than 50% of DevOps roles external to mitigate knowledge leakage and dependency risks.

AI-Driven Offloading: The Next Frontier

Emerging AI tools are beginning to automate aspects of data warehousing:

  • Schema Generation: AI can suggest optimized table structures based on source data profiles.
  • ETL/ELT Code Snippets: Auto-generation of transformation scripts for common data patterns.
  • Monitoring & Alerting: Machine learning models to detect anomalies and performance bottlenecks.

While these solutions can accelerate development, they work best under the guidance of your experienced internal team, who define requirements, review outputs, and ensure alignment with business objectives.

Setting Clear Boundaries

To manage the consultant-internal balance effectively, define:

  1. Scope of Work: Specify deliverables, timelines, and handover expectations for every engagement.
  2. Knowledge Transfer Plan: Require documentation, training sessions, and code reviews to embed expertise internally.
  3. Governance Model: Establish who makes architectural decisions and how change requests are processed.
  4. Resource Thresholds: Limit external headcount to a reasonable percentage (e.g., under 50%) to avoid over-reliance.

Key Benefits and Risks

Benefits:

  • Speed: Hit the ground running with proven accelerators and expert guidance.
  • Flexibility: Scale resources up or down based on budget cycles and project phases.
  • Cost Efficiency: Avoid long-term commitments; external consultants can be released when budgets tighten.

Risks:

  • Knowledge Drain: Too many external experts can lead to critical know-how walking out the door.
  • Strategic Misalignment: Consultants may optimize for short-term wins rather than your long-term roadmap.
  • Dependency: Over-outsourcing creates vendor lock-in and potential service disruptions if relationships end.

Best Practices for Effective Outsourcing

1. Start with a Pilot: Engage consultants on a small, well-defined project to validate fit and process.

2. Embed Consultants: Position them alongside your team for on-the-job training, rather than in isolation.

3. Prioritize Documentation: Ensure every architecture decision, data model, and pipeline is clearly recorded.

4. Rotate Responsibilities: Alternate tasks between internal staff and consultants to spread knowledge.

5. Review Regularly: Conduct quarterly check-ins to reassess external involvement, goals, and budget alignment.

Conclusion

Outsourcing your entire data warehouse is rarely advisable—this remains a core strategic asset that demands internal stewardship. However, judicious use of external consultants, cloud infrastructure, and AI-driven tools can accelerate your journey, fill critical skill gaps, and optimize costs. By setting clear boundaries, emphasizing knowledge transfer, and maintaining a healthy mix of internal and external talent, you can reap the benefits of outsourcing without surrendering control.

Watch the Video

Modeling Reference Data in Data Vault 2.0 with WhereScape

Understanding the Role of Reference Data

In the world of modern data warehousing, reference data plays a crucial role in maintaining consistency and adding business context. But how should reference or master data be modeled effectively, especially within the framework of Data Vault 2.0 using WhereScape?

This article breaks down best practices and modeling techniques to help data engineers and architects manage reference data in a scalable, maintainable way.


What is Reference Data?

Reference data consists of values that are used to categorize or describe other data within business systems. It typically includes code-to-description mappings that offer meaning to otherwise abstract identifiers.

Unlike business keys, which identify business entities or objects (like customers or products), reference data keys do not directly point to business objects. They simply support them with contextual information.

Examples of Reference Data:

  • ISO codes for countries
  • Official country names
  • Continent or region classifications
  • Currency types or codes

One critical aspect of reference data is that it can change over time. Country names may change, new currencies may be introduced, and existing classifications may be updated. This means that how we model and store this data must account for such changes.

Data Vault 2.0 and Reference Data Modeling

Data Vault 2.0 introduces a methodology designed for agility, auditability, and scalability in enterprise data warehousing. When dealing with reference data in this architecture, the recommended standard involves two main components:

  • Reference Table (Reference Hub)
  • Reference Satellite

Each serves a distinct purpose and helps manage both static and changing attributes efficiently.

The Reference Table (Reference Hub)

The reference table acts similarly to a hub in traditional Data Vault modeling, but with important distinctions:

  • Contains reference codes or keys (e.g., ISO country code)
  • Does not use a hash key – unlike typical hubs
  • May include additional static attributes that do not change over time

This component provides a centralized location for managing consistent lookup values across the enterprise. While it’s technically referred to as a “hub,” it’s specialized for reference data and behaves slightly differently in structure and intent.

The Reference Satellite

Reference satellites extend the reference table to store attributes that may evolve over time. This aligns well with the Data Vault 2.0 philosophy of tracking change history and ensuring auditability.

Characteristics of a Reference Satellite:

  • Includes reference codes or keys to link back to the reference table
  • Stores descriptive attributes that may change over time (e.g., country name updates, new regional classifications)

This design allows data teams to accommodate both historical tracking and the dynamic nature of reference data.

Why Model Reference Data This Way?

There are several strategic and operational advantages to modeling reference data using this structure in Data Vault 2.0:

  1. Separation of concerns: Static and changing data are stored in different layers (table vs. satellite), improving data integrity.
  2. Scalability: Future changes in reference attributes or descriptions are easier to manage and don’t affect historical records.
  3. Auditability: Data Vault’s natural historization supports full lineage and change tracking, which is ideal for regulated industries.
  4. Adaptability: Requirements for historization may evolve over time. Modeling reference data into satellites regardless of current needs ensures readiness for future changes.

Best Practices for Implementation

When implementing this in WhereScape, which automates the Data Vault modeling process, follow these best practices:

1. Always Use a Reference Satellite

Even if you don’t need to historize now, model your reference data in a satellite. Future-proofing your model saves costly rework later.

2. Use Reference Hubs When Multiple Sources Exist

If your organization consumes reference data from multiple systems (e.g., two systems providing different descriptions for the same country code), a reference hub helps consolidate and align these variations around the same key.

3. Avoid Hash Keys in Reference Hubs

Because reference tables don’t represent business objects, there’s no need for a surrogate hash key. Stick with the natural reference code (e.g., “US” for United States) as your unique identifier.

4. Design Satellites for Change

Structure your reference satellites to easily accommodate attributes that may change. Make use of effective date fields to track the history of these changes.

Common Pitfalls to Avoid

  • Modeling reference data as business hubs – this confuses context with core business entities
  • Skipping the satellite – even when attributes are static today, change is inevitable
  • Using hash keys unnecessarily – keep your design clean and minimal in reference structures
  • Ignoring multiple source issues – consolidate differing descriptions with a reference hub

Conclusion

Modeling reference data correctly is a small but critical part of building a reliable, scalable, and auditable Data Vault. By following the recommended structure—a reference table paired with a reference satellite—you create a flexible and future-proof design.

WhereScape users benefit from automation, but understanding these modeling principles ensures you’re applying the tool in a way that aligns with industry best practices and prepares your warehouse for long-term success.

Whether you’re handling ISO country codes or global currency classifications, treat your reference data with the same care you would your core business entities—because it gives those entities their context.

Watch the Video

Chatbot Implementation Using Retrieval-Augmented Generation

Chatbot RAG Retrieval Phase

In today’s AI-driven world, businesses are looking for smarter, cost-effective chatbot solutions that enhance customer interactions and streamline internal operations. While traditional chatbot models often struggle with outdated or generic responses, modern advancements have opened the door to more dynamic and intelligent systems.

This article is for business leaders, developers, and AI enthusiasts looking to implement smarter chatbot solutions. It explores Retrieval-Augmented Generation (RAG), a game-changing approach that enhances chatbot performance by retrieving relevant information in real time. By the end, you’ll not only understand why RAG is so powerful but also how to implement it effectively to build scalable, cost-efficient, and context-aware chatbots using Google Cloud Platform Services.

Implementing Production-Ready RAG Chatbots: Enhancing Information Retrieval with AI

Join our webinar for a practical guide to building and deploying powerful, RAG-driven chatbot solutions. We’ll show you how to leverage essential Google Cloud services for effective implementation, enabling your chatbot to deliver more accurate and relevant responses. Register for our free webinar, July 15th, 2025!

Watch Webinar Recording

The Challenge of Deploying Chatbots

Chatbots are widely used in businesses to automate customer support and streamline internal operations. While large language models (LLMs) have improved chatbot capabilities by generating human-like responses, they come with significant challenges. LLMs require costly fine-tuning, extensive resource usage, and ongoing maintenance, making them impractical for many companies. Additionally, fine-tuned models quickly become outdated, requiring frequent retraining to stay relevant.

An alternative approach is Retrieval-Augmented Generation, which dynamically retrieves relevant information in real time, rather than relying solely on pre-trained data. This allows chatbots to stay up-to-date, reduce costs, and improve accuracy, making RAG a powerful solution for businesses looking for intelligent and scalable AI-driven chatbots without the high expenses of fine-tuning or pre-training.

RAG Architecture

RAG is revolutionizing the way chatbots interact and provide information. But how does this powerful architecture actually work? The magic lies in its two distinct phases: The Preparation Phase, where the knowledge base is built, and the Retrieval Phase, where user queries are processed and relevant information is retrieved to generate a response. Each phase plays a crucial role in creating an intelligent and responsive system. Let’s explore how RAG works in detail, starting with the preparation phase.

Preparation Phase

RAG Chatbot Architecture General Preparation Phase

Data Selection: The preparation begins by selecting the appropriate data for the chatbot’s knowledge base. This typically involves choosing organized sources like databases, which contain the structured information necessary for the chatbot to function effectively.

Data Preprocessing: To prepare the raw data for optimal use in a RAG system, preprocessing is essential. This stage serves three primary purposes: enabling efficient retrieval, ensuring compatibility with the generative AI model, and optimizing for effective embedding generation. Efficient retrieval hinges on assigning unique identifiers, such as IDs, to each data element. This allows the system to quickly locate and access specific pieces of information. To enhance both the generative AI model’s understanding and the quality of embeddings, techniques such as flattening tables, tokenization, text cleaning, stemming, lemmatization, stop word removal, and data type conversion can be employed. These techniques refine the data’s structure and content, making it easier for the generative AI model to process and understand, while also optimizing the data for capturing semantic meaning and relationships in the embeddings.

Embedding Generation: With the data now preprocessed and refined, it’s ready to be transformed into a format suitable for efficient retrieval. This is where embedding generation comes in. This step involves converting the preprocessed data into numerical vectors known as embeddings using a specifically trained embedding model. The embeddings capture the semantic meaning of the data, encoding relationships between words, concepts, and ideas, which enables efficient retrieval of relevant information. The specific embedding model used will depend on the nature of the data and the requirements of the RAG system.

What is an Embedding?

In natural language processing, an embedding is a numerical representation of a word, phrase, or document that captures its meaning. These numerical vectors, which can range from a few hundred to many thousand dimensions, are designed so that words or documents with similar meanings have embeddings that are close together in the vector space.

For example, in an embedding space, the word “cat” would be located much closer to the word “lion” (another feline) than to the word “car” (an unrelated object). Meaning that even if two words were nearly identical in spelling but had vastly different meanings, their embeddings would be distant. This spatial arrangement reflects the semantic relationship between the words.

This allows AI systems to understand relationships between words and concepts, enabling them to perform tasks such as identifying similar documents. Embeddings are a fundamental building block for many AI applications, including RAG.

Saving the Embeddings in a Vector Database: The final step in the preparation phase is to store the generated embeddings in a specialized database designed for handling vector data. This is crucial because traditional databases aren’t optimized for storing or searching high-dimensional vectors. Saving the embeddings in a vector database ensures that the RAG system can quickly pinpoint the most relevant information in the knowledge base when responding to user queries.

Now looking at Data Vault’s architecture, we see that to some extent it is quite similar to what Databricks proposes: a multi-layer solution composed of a Staging layer, a Raw Data Vault and a Business Vault, followed by the domain-specific information marts. In the image below, we can see an example of a Data Vault architecture.

Retrieval Phase

With the knowledge base now prepared and ready for efficient retrieval, let’s explore how the RAG system interacts with users and generates responses in real-time.

Chatbot RAG Retrieval Phase
  1. User Interaction: The process begins with a user interacting with the chatbot through a user interface. This interaction could be a chat window, or any other platform that allows users to input queries.
  2. Embedding Generation: The user query is then converted into an embedding using the same embedding model that was used to process the knowledge base during the preparation phase. Consistency is vital because different embedding models might produce different numerical representations, hindering the similarity search process.
  3. Similarity Search and Retrieval: The query’s embedding is used to perform a similarity search within the same vector database that contains the knowledge base embeddings. This search identifies the most semantically similar embeddings, returning their corresponding IDs.
  4. Retrieve relevant Information: The IDs retrieved from the similarity search are then used to query the preprocessed data from the knowledge base. This lookup retrieves the corresponding documents in their preprocessed text form, providing the generative AI model with the necessary context for generating a response.
  5. Generative AI: The retrieved information, along with the original user query, is passed to a generative AI model. This model uses its knowledge to generate a relevant response to the user’s query. The generative process allows RAG systems to provide answers that are more than just basic information retrieval.
  6. Delivering the Response: Finally, the generated response is delivered back to the user through the user interface. The response could be in the form of text displayed in a chat window or a spoken response from a voice assistant.

Implementing a RAG-Based Chatbot: A Practical Example

Now that we’ve explored the underlying architecture of RAG, let’s see how you can implement a RAG-based chatbot using services from the Google Cloud Platform. This example focuses on building an internal knowledge chatbot that can answer employee questions based on internal documents from a knowledge platform.

Data Preparation

The foundation of any effective RAG system is well-prepared data. This initial phase focuses on transforming your raw knowledge into a searchable format, ensuring documents are ready for efficient retrieval.

Chatbot RAG Data Preparation in Google
  • Data Selection and Preprocessing: First, you’ll need to gather the relevant internal documents, preprocess them and save the data in a data platform like Google Cloud Storage.
  • Embedding Generation: Once the preprocessed data is securely stored, Google Cloud Vertex AI is utilized to transform this data. Vertex AI extracts the textual content and converts it into high-dimensional vector embeddings, creating numerical representations that capture the semantic meaning of your documents. You can choose from various pre-trained embedding models or fine-tune your own model based on your specific needs.
  • Vector Database: With the embeddings successfully generated, Google Cloud Vertex AI Vector Search then serves as the vector database. It efficiently stores these high-dimensional embeddings and is designed to enable rapid and accurate similarity searches during the retrieval phase.

Retrieval Architecture

This section outlines the Retrieval-Augmented Generation architecture of our Google Chat chatbot. It describes the flow of a user’s query through various Google Cloud Platform services, from initial submission to the delivery of a generated response, creating a robust and intelligent conversational experience.

RAG Pipeline
  1. User Interaction: The user begins by asking a question within Google Chat. Google Chat serves as the user interface, directing the query to the Conversational Agents platform.
  2. Request Orchestration: Conversational Agents receives the user’s input. It then triggers a webhook call, sending the user’s query to our RAG orchestrator service, which is hosted on Google Cloud Run.
  3. User Query Embedding: From this point, the Google Cloud Run service takes over as the central orchestrator of the RAG pipeline. It starts by processing the user’s query, generating a high-dimensional vector embedding of it using the same embedding model that was utilized during the data preparation.
  4. Information Discovery: The generated user query embedding is then transmitted from Cloud Run to Vertex AI Vector Search. Vertex AI performs an efficient similarity search, identifying and returning the ID(s) of semantically similar documents from the knowledge base based on the provided embedding.
  5. Relevant Information Retrieval: With the identified document ID(s) obtained from Vertex AI Vector Search (these IDs precisely match our preprocessed documents that are most relevant to the user’s query), the Cloud Run service accesses Google Cloud Storage. From Cloud Storage, the full text content of these matched knowledge base pages is fetched. These documents provide the essential context required for accurate response generation.
  6. Generative AI Response: The Cloud Run service then combines the original user query with the retrieved document content into a carefully constructed prompt. This comprehensive prompt is sent to the Gemini API, leveraging Google’s large language model to generate a natural language answer.
  7. Response Delivery: The generated answer from the Gemini API is received by the Cloud Run service. The Cloud Run service formats this response and sends it back to Conversational Agents.
  8. Final User Delivery: Conversational Agents receives the generated answer and seamlessly relays it back to the user within Google Chat, completing the interaction.

This example demonstrates how you can leverage GCP services to implement a RAG-based chatbot for internal knowledge sharing. By combining data preparation, embedding generation, similarity search, and generative AI, you can create a powerful tool that empowers employees with quick and easy access to relevant information.

Close Menu