Introduction
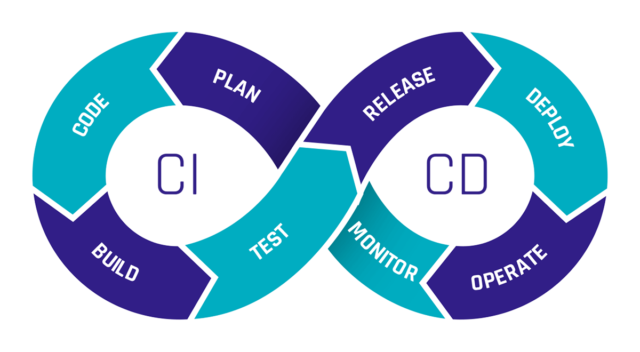
In this article, we will talk about how you can improve your CI/CD (Continuous Integration / Continuous Deployment) development by implementing IaC (Infrastructure as Code) and a well structured automated pipeline for error-prone deployments. For IaC, we will specifically use Terraform as the chosen software, since it is the most commonly used cloud-agnostic tool.
When working with cloud, it is most important to always have a good overview of the development of your infrastructure. It can grow rather huge in bigger companies and should be organized. This is where IaC comes in handy. Using software like Terraform lets you isolate parts of your infrastructure into their own representative projects, allowing for much better maintenance.
Not only is IaC helpful for improving development in your company, but it is also essential to secure your deployments with a pipeline that monitors upcoming changes in the project. Nobody wants to deploy changes and accidentally break everything. Error checks are thus mandatory to ensure a safe working environment. In the upcoming parts of this article, we will show you some options on how you can implement a good and safe IaC pipeline for your needs step by step.
How to get started – Terraform
When it comes to developing Infrastructure on cloud providers like AWS, Google Cloud, Azure, and so on, it is always good to have better governance over everything that is currently deployed on these services.
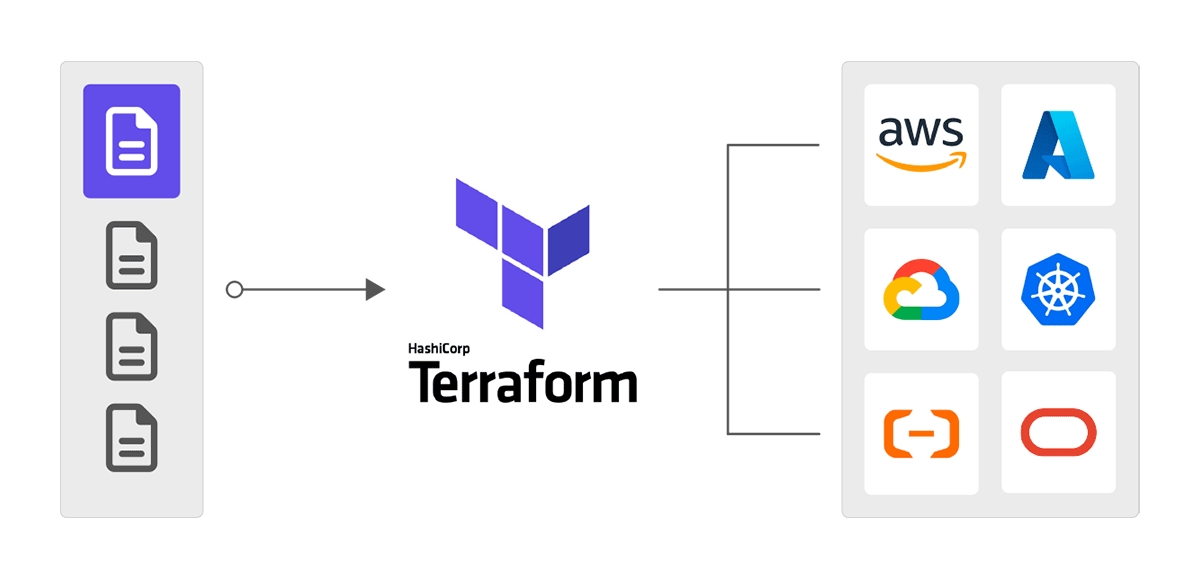
To have such governance, it is important to divide the existing or new infrastructures into different projects. Infrastructure as Code (IaC) involves the management and provisioning of infrastructure using code, as opposed to relying on manual procedures. Introducing Terraform:

Terraform is one of the biggest IaC software out there and allows for exactly this. Writing your infrastructure inside of a file allows you to fully control every part of your project and also isolates it from everything else on the provider. Deploying new resources, adjusting, or even deleting them can all be done by just changing the code in the file and applying the changes via Terraform itself allowing for great continuous Integration (CI).
Even resources that have been created before the use of IaC can easily be imported to a Terraform file to be managed by it in retrospect. Therefore, Terraform is the ideal starting point for an agile development in your company.
Using repositories for automation – Git
Now that all of your infrastructure is managed in Terraform and separated into distinct projects, we can move to the next step. Since usually a DevOps team consists of more than one person, it is mandatory to get your newly created files accessible by the entire team. Therefore, you should move them to a version control system like Git, which usually comes with a lot of features that are also really helpful to set up a proper pipeline automation.
When using an online code repository like Github, you can create so-called “Actions” to instantly deploy changes when pushing a new commit. This ensures a single source of truth for the infrastructures. Even mistakes can be easily fixed by checking previous changes in the files or just by going back to a previous working commit.
Moreover, every deployment will now happen automatically which is exactly what we want to implement. Using this form of automation gives great value to the continuous deployment (CD) part of our pipeline.
Optimizing your automation – Security
We are now at the point where your infrastructures are managed using Terraform and it also has an automated deployment setup in our repository system like the deployment workflow in Github Actions. But we still lack one big point to bring our pipeline to its full potential. This point being security.
Currently, whenever a change gets versioned on your repository, it instantly deploys those changes (as long as there are no errors in the terraform files). Somebody could accidentally remove a resource and commit these changes even though it was not intended, possibly causing crucial problems. This is why we want to secure the process of deploying changes.
Luckily, there are a lot of options for securing your pipeline. In the following part, we will quickly run over some solutions to ensure security in your deployment pipelines environment.
Manual Approval via Repository
We already have your automated deployment workflow on your online code repositories (e.g. Github) which deploys all new committed changes. But many of these systems also support the feature of manual approval. This feature will put a break in between push and deployment and first ask other employees to check over the upcoming changes.
Only if enough people have approved the changes, the deployment continues. An example can be the use of the Github Deployment Protection rules. You can define a specific number of requested reviewers, and the deployment is only executed if this number of reviewers approves it.
Alternatively, you could create your own workflow and set a number of needed approvals in your team inside of the workflows config file.
Software for Best Practices
Working infrastructure can still have security flaws that might have been overlooked by the approvers. For example, you have a server that can easily be approached by the internet even though it is supposed to be private and only accessible by your other infrastructure.
These kinds of problems also are a big threat to the security inside of your pipeline. Luckily there already have been people who are aware of this issue and developed dedicated software to solve this problem.
For developments outside of Terraform, there is the program “pre-commit” which scans for best practices over so-called hooks. These hooks set automated checks and tasks before committing changes. If any of those fail the commit will be aborted until the causing problem is fixed.
When developing with terraform specifically you could use programs like “tfsec” which also checks your written code for best practices. It does not let you deploy changes when there are critical health issues inside of your infrastructure and marks them as errors.
Conclusion
With everything set up you should now have an optimized and secure CI/CD pipeline to work with inside of your DevOps team.
After reading this article you should be able to see the great perks of implementing IaC, automating, versioning and security measures into your CI/CD pipeline.
Even though setting up all these parts can be a little time consuming at start it will get you a much more agile approach to your development in your business.
By using this method you minimize any risks of deployment, secure your deployment workflow, keep a quick delivery in results and thus prevail good team agility.