search
0

Mastering Salesforce Lead Conversion: A Quick Guide for Beginners

Your Lead Has Been Converted

Summary

Unlock the secrets of Salesforce Lead Conversion in our comprehensive video guide. Dive into essential activities, from call logging to task creation, and discover the pivotal role of effective lead conversion in maximizing sales efficiency. Tailored for beginners in Salesforce Sales Cloud, this resource empowers you to optimize your sales pipeline, enhance customer engagement, and propel your business to new heights. Elevate your strategy with our expert insights for sustained success.


Introduction to Lead Conversion Process in Salesforce

Welcome to an insightful exploration of the Lead Conversion process in Salesforce, a pivotal element in the realm of sales and customer relationship management. This video serves as a comprehensive guide, demystifying the intricacies of converting potential leads into valuable opportunities.


Overview of Lead Conversion

In the dynamic landscape of sales, converting leads is a critical step towards transforming prospects into customers. The Lead Conversion process in Salesforce is a strategic approach that streamlines this transition, ensuring that no valuable information is lost in the conversion journey. From initial contact to closing deals, every step is meticulously orchestrated to maximize efficiency and effectiveness.


Understanding Salesforce Activities

Our video delves into the various activities that play a crucial role in managing leads. From logging calls to creating tasks and tracking interactions, Salesforce offers a robust set of tools to streamline communication and ensure that every lead is nurtured effectively.


Why it Matters

Effective lead conversion is the lifeblood of successful sales operations. It is not merely a checkbox exercise but a dynamic process that fosters a deeper connection with your potential customers. By understanding and optimizing the Lead Conversion process, businesses can enhance their sales pipeline, improve customer engagement, and ultimately drive revenue growth.

We demystify the Lead Conversion process, empowering you to unlock the full potential of your sales endeavors within the Salesforce ecosystem. Elevate your sales strategy, engage leads effectively, and propel your business towards sustained success.


Target Audience

This video caters to a diverse audience, particularly those navigating the Salesforce Sales Cloud for the first time. Beginners in the Salesforce ecosystem will find valuable insights into the Lead Conversion process, gaining a solid foundation to harness the full potential of Salesforce Sales Cloud. Whether you’re a sales professional, business owner, or someone curious about optimizing lead management, this video provides a user-friendly entry point into the world of Salesforce.


Watch the Video

Column Store Compression vs Page Compression

Watch the Video

In our ongoing series, Michael Olschimke, our CEO, delves into a viewer’s question:

“During boot camp, Michael advises switching on page compression on the MS SQL server platform. Now when the platform supports column compression (via column store indexes) would you advise it instead? Do you have any project experience with it?”

The viewer seeks Michael’s insights on a specific query that emerged during a boot camp session. The question revolves around the recommendation to enable page compression on MS SQL Server and whether, with the advent of column compression via column store indexes, Michael would now advise using the latter. The viewer is particularly interested in understanding Michael’s project experiences related to this choice.

In response, Michael shares his expertise on the nuances of compression techniques in the context of MS SQL Server. He discusses the merits of both page compression and column store indexes, offering practical insights into their application based on project experiences. This session provides valuable guidance for optimizing storage and performance in the MS SQL Server platform, exploring the trade-offs and benefits of each compression approach.

For those navigating the complexities of compression choices within their SQL Server environment, Michael’s knowledge in this episode offers clarity and actionable recommendations, making it a valuable resource for Data Vault practitioners.

Agile Data Warehousing: An Introduction

Watch the Webinar

This webinar overviews a disciplined, hybrid approach to agile data warehousing.

This proven methodology is mostly agile, adopting great ideas from lean and traditional WoW to address the shortcomings of a pure agile approach. Data warehouse (DW) teams work differently than software development teams because they face fundamentally different challenges.

As a result, methods that work well for agile software development prove insufficient for building and evolving DWs. Learn how agile DW works in practice, working through the full lifecycle from beginning to end and then back again.

Watch Webinar Recording

Capturing CDC Flags in Data Vault

Watch the Video

In our ongoing series, Michael Olschimke, our CEO, engages with a viewer’s question:

“If you get CDC data and insert/update/delete flag, then would you split it to separate satellite table or leave it on regular sat?”

The specific query revolves around handling CDC (Change Data Capture) data, particularly when faced with insert/update/delete flags. The viewer seeks guidance on whether to split this data into separate satellite tables or retain it within a regular satellite.

In response, Michael addresses the intricacies of managing CDC flags within the Data Vault framework. He explores the pros and cons of both approaches, providing valuable insights into the considerations that influence the decision-making process. This session offers practical advice on structuring satellite tables to effectively capture and utilize CDC flags in a Data Vault environment.

For those grappling with the nuances of integrating CDC data seamlessly into their Data Vault setup, Michael’s expertise provides clarity and actionable recommendations, making this episode of Data Vault Insights a valuable resource.

The Potentials of Microsoft Fabric for Business Intelligence Solutions

Microsoft Fabric

Microsoft Fabric for Business Intelligence

Microsoft Fabric is an all-in-one cloud-based analytics platform that provides a unified environment for data professionals and business users to collaborate on data solutions. It is a powerful analytics platform that helps businesses automate workflows, improve productivity, and gain insight from their data.

In today’s data-driven world, businesses are increasingly turning to business intelligence (BI) solutions to gain insight from their data. BI solutions can help businesses improve their decision-making, optimize their operations, and gain a competitive edge.

The Potentials of Microsoft Fabric for Business Intelligence Solutions

Microsoft Fabric is a new and innovative data analytics platform that has the potential to revolutionize the way businesses make decisions. With Fabric, organizations can ingest, store, process, and analyze all of their data in one place, using a unified set of tools and services. This makes it possible to get insights from data faster and easier than ever before. We will explore the potential of Microsoft Fabric for business intelligence solutions. We will discuss how Fabric can be used to improve data quality, streamline analytics workflows, and deliver insights to users. This webinar is interesting for everyone wanting to learn more about how to use Microsoft Fabric to get more value from data. And even more interesting for Data engineers and analysts, Business intelligence professionals, and IT decision-makers. Register now for this free webinar and learn how Microsoft Fabric can help you take your business intelligence solutions to the next level!

Watch webinar recording

What to expect

This newsletter will take you on a journey to discover the transformative power of Microsoft Fabric for business intelligence solutions. You will explore the various workloads and experiences that Microsoft Fabric offers, gaining a comprehensive understanding of its capabilities. You will also uncover the benefits that Microsoft Fabric brings to data-driven decision-making, enabling you to make informed choices that propel your business forward. Finally, you will delve into the potential that Microsoft Fabric holds for enhancing business intelligence solutions, empowering you to unlock new levels of insight and decision-making capabilities.

To dive even deeper, watch the webinar recording about this topic for free. Click here to register.

What is Microsoft Fabric?

Microsoft Fabric is an all-in-one cloud-based analytics platform that provides a unified environment for data professionals and business users to collaborate on data solutions. Fabric offers a suite of integrated services that enable you to collect, store, process, and analyze data in a single platform, which is built on a foundation of Software-as-a-Service (SaaS).

Microsoft Fabric provides tools for people with all levels of data expertise and connects with the tools businesses use to make decisions.
Fabric itself is an umbrella for the following Microsoft cloud-based services that constitute Microsoft Analytics Portfolio:

  • Azure Data Factory
  • Azure Event Hubs
  • Azure Data Explorer
  • Azure Artificial Intelligence
  • Azure Databricks
  • Azure Synapse Spark Pools
  • Azure Synapse Analytics
  • and Microsoft Power BI

The above items have been re-tooled and taken to the next level inside the Microsoft Fabric.

Workloads of Microsoft Fabric

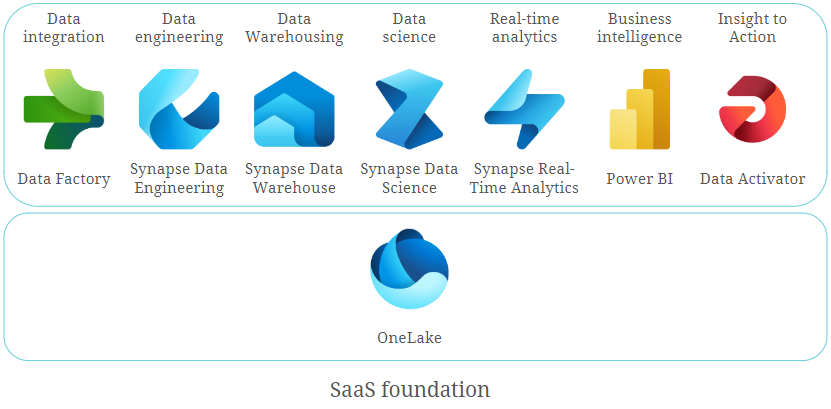
Fabric includes the following workloads or experiences:

  • Data integration
  • Data Engineering
  • Data Warehousing
  • Data Science
  • Real-time analytics
  • Business intelligence
  • Insight to action

The foundation of these experiences in Fabric is the data lake, which is known as OneLake. The below picture illustrates the concept of Microsoft Fabric.

Microsoft Fabric

Let’s review every component of Fabric in a bit more detail.

Data Integration

Microsoft Fabric’s data integration workload, called Data Factory, brings data movement capabilities to both dataflows and data pipelines.

  • Dataflows offer flexible and user-friendly ways to transform data with over 300 transformations. It is built on the familiar Power Query experience, which is available in several Microsoft products and services, such as Excel, Power BI, Power Platform, and others.
  • Data pipelines let you create flexible data workflows to meet your organizational goals. You can use the built-in data orchestration features to refresh your dataflows, process large datasets, and define complex control flow pipelines.

Data Engineering

Data Engineering Experience or Synapse Data Engineering offers a top-tier Spark platform, fostering rich authoring experiences. This empowers data engineers to conduct extensive data transformations and facilitates widespread access to data via the lakehouse.

Microsoft Fabric provides various data engineering capabilities to ensure that your data is easily accessible, well-organized, and of high quality. From the data engineering homepage, you have the following options:

  • Lakehouse
    Create and manage Lakehouse. Lakehouse is a logical location in OneLake where you store and manage structured and unstructured data using various tools and frameworks. You can even mount an external storage account into your Lakehouse with the Shortcut feature.
    You can use the SQL Endpoint to query Lakehouse tables, but only read-only queries are supported.
  • Notebook
    Write and run code in popular programming languages, like Python, R, and Scala. Leverage notebooks for data ingestion, transformation, analysis, and other data processing tasks.
  • Environment
    Within an environment, you have the flexibility to choose from a variety of Spark runtimes, configure your computational resources, and incorporate libraries – either from public repositories or by uploading locally-built custom libraries. Attaching these environments to your notebooks and Spark job definitions is a seamless process.
  • Spark Job Definition
    Define, schedule, and manage Spark jobs to process big data in your lakehouse, apply transformation logic to the data, and more.
  • Data Pipeline
    Design and orchestrate pipelines to copy data into your lakehouse, schedule Spark jobs and notebooks to process high-volume data, and automate data workflows via integration with Data Factory.

Data Warehousing

Data warehouse or Synapse Data Warehouse is a lake-centric repository for storing and analyzing structured data built on a distributed processing engine. Data warehousing workload benefits from the rich capabilities of the SQL engine over an open Delta Lake format, which are parquet files published as Delta Lake Logs and stored in OneLake. Delta Lake Logs enable ACID transactions. A warehouse can contain only structured data. Here you can not only read data with SQL but also execute inserts and updates.

Data Science

The Data Science Experience, or Synapse Data Science, allows for the creation, deployment, and operationalization of machine learning models. Data scientists are empowered to enrich organizational data with predictions and allow business analysts to integrate those predictions into their BI reports. Data Science in Fabric provides you with the following options:

  • ML model
    Leverage machine learning models to forecast results and identify irregularities within datasets.
  • Experiment
    Engage in the experimentation phase by generating, executing, and monitoring the evolution of various models for validating hypotheses.
  • Notebook
    Utilize the Notebook feature to delve into data exploration and construct machine learning solutions through Apache Spark applications.
  • Environment
    This option has the same purpose as in Data Engineering experience.

Real-Time Analytics

Real-Time Analytics in Fabric or Synapse Real-Time Analytics is a fully managed big data analytics platform optimized for streaming and time-series data. It utilizes a Kusto Query Language (KQL) — an engine with exceptional performance for searching structured, semi-structured, and unstructured data. Real-Time Analytics is fully integrated with the entire suite of Fabric products for data loading, data transformation, and advanced visualization scenarios. There are three components of the Real-Time Analytics in Fabric:

  • KQL Database — the place to store streaming data. It uses OneLake as the underlying storage system.
  • KQL Queryset — run queries on your data to produce shareable tables and visuals. Save, manage, export, and share KQL queries. KQL Queryset is an analog of SSMS for a SQL Database.
  • Eventstream — capture, transform, and route real-time event stream to various destinations in the desired format with no-code experience. It is a hub of streaming data, where multiple sources (including Event Hub) and various destinations (including KQL database) can be set.

Business Intelligence

From the BI side, Fabric has Power BI, one of the world’s leading Business Intelligence platforms. It represents a set of services, tools, and connectors that turn your data into interactive visual reports and dashboards. In Fabric, there are some new features and enhancements to work with Fabric objects and experiences. Among these are:

  • Direct Lake mode connection that is based on loading parquet-formatted files directly from a data lake without the need to import the data into a data set.
  • Integration with Synapse Real-Time Analytics to produce real- or near-real-time reports.
  • Semantic link that allows loading data from Power BI data sets into Data Science experience and others.

Insight to Action

Insight to action in Fabric offers Data Activator, which is an experience for automatically triggering actions when certain conditions are met in the incoming data. It works with Eventstreams for real-time data and Power BI for batch data. There are three possible actions that can be configured after the conditions are detected:

  • Email — get notified by email.
  • Teams message — send a notification to an individual or a channel in Teams.
  • Custom action — perform a custom action to call Power Automate workflow.

Data Lake

OneLake is the central component of all Fabric services. It is a built-in, unified data lake that stores all organizational data and is used by all Fabric experiences. OneLake uses ADLS Gen2 as its underlying storage.

To simplify management across the organization, OneLake is organized hierarchically. Each tenant has only one OneLake instance, which provides a single namespace that extends over users, regions, and even clouds. For easy handling, data in OneLake is divided into manageable containers.

Similar to Microsoft OneDrive, any developer or business unit in the tenant can create their own workspaces in OneLake. They can ingest data into their own lakehouses, and start processing, analyzing, and collaborating on the data. All Fabric experiences are bound to and operate on top of OneLake.

So What Are Microsoft Fabrics Potentials?

Microsoft Fabric has the potential to revolutionize the way that businesses build and deploy business intelligence solutions. Here are some of the key potentials:

  • Unified data platform: Microsoft Fabric provides a unified data platform for storing and analyzing all types of data, including structured, semi-structured, and unstructured data. This means that businesses can use a single set of tools and services to manage all aspects of their data pipeline, from data ingestion and preparation to data analysis and visualization. This can help to reduce complexity and improve efficiency.
  • End-to-end analytics: Microsoft Fabric provides a complete set of capabilities for building and deploying end-to-end analytics solutions. This includes data engineering, data science, data warehousing, and business intelligence. This simplifies the development and deployment of analytics solutions and reduces the need for specialized expertise.
  • AI-powered insights: Microsoft Fabric embeds AI and machine learning capabilities throughout the platform. This can be used to automate tasks, generate insights, and improve the accuracy of predictions. This can help businesses to make better decisions faster.
  • A unified platform accommodating diverse expertise: Data professionals with varying backgrounds can leverage their skill sets to collaborate on a singular data solution. This inclusive environment allows individuals from different disciplines and proficiency levels to contribute their expertise to a common data project.
  • Reduced data silos: It eliminates the need to move data between various systems, making it easier to get a complete view of your business.
  • Reduced costs: Microsoft Fabric can help businesses reduce the costs associated with building and deploying business intelligence solutions. This is because it eliminates the need to purchase and maintain multiple systems and it provides a number of features that can automate tasks and improve efficiency.

In essence, Microsoft Fabric holds the promise of simplifying and rendering the development and deployment of robust business intelligence solutions more accessible and cost-effective for businesses, regardless of their scale or size.

Conclusion

Microsoft Fabric represents a paradigm shift in the realm of business intelligence solutions. With its unified data platform, end-to-end analytics capabilities, and AI-driven insights, Fabric streamlines data management from collection to visualization. The platform’s ability to cater to diverse skill sets and backgrounds, reducing data silos, and automating tasks illustrates a remarkable potential to revolutionize the industry.

Through its components, such as Data Factory, Data Engineering, Data Warehousing, Data Science, Real-Time Analytics, Power BI, Data Activator, and the robust foundation of OneLake, Microsoft Fabric promises a future where businesses can efficiently harness the power of data to make informed decisions and drive innovation. Ultimately, it has the potential to democratize powerful business intelligence solutions, making them more accessible and cost-effective for enterprises of all scales.

Processing Streaming Data in Data Vault

Watch the Video

In our continuous Data Vault Friday series, Julian Brunner, our BI Consultant, takes on an intriguing question posed by an audience member.

“We are receiving real-time messages in JSON format. Are there any best practices, on how to model real-time data?”

In response to this query, Julian delves into the nuances of handling real-time data streams and outlines the recommended practices for modeling such data in the Data Vault framework. He shares insights on the architecture, methodologies, and considerations crucial for effectively incorporating real-time JSON messages into the Data Vault.

For those navigating the complexities of integrating real-time data seamlessly into their Data Vault setup, Julian’s expertise provides valuable insights and practical solutions, making this Data Vault Friday session a must-watch.

Stop Bleeding Money! 10 Steps to Save on Your Resource Consumption

Watch the Webinar

All organizations working with data platforms have the challenge to use their available budgets efficiently.

Especially in the new world where everyone is going to the Cloud, there are many new functionalities that give organizations the option of using their funds more efficiently than ever.

But on the flip side, it also gives everyone the possibility of scaling IT expenses endlessly, which can sometimes end in a huge monthly bill.

This webinar is a small collection of ways to create and maintain a cost-efficient data infrastructure. There will be 10+ tips on what your organization and your team can do, to reduce your monthly bill without any negative effects on your overall performance.

Watch Webinar Recording

Webinar Agenda

1. Intro
2. 10 Steps
3. Honorable Mentions
4. Summary

Loading CDC Data Into the Raw Data Vault

Watch the Video

In our recurring Data Vault Friday series, Michael Olschimke, our CEO, addresses a thought-provoking question about integrating the CDC data into the Raw Vault.

“A record from change data capture has a column with the type of operation (CREATE / DELETE / UPDATE) and multiple timestamp columns and it is inserted in the staging area. The record is going to be loaded in append-only (insert-only) in the Raw Data Vault. Are there attention points between CDC and Raw Vault to pay attention compared to a traditional loading of files in the staging area?”

Michael delves into the key considerations and nuances that distinguish the loading process of CDC data into the Raw Vault from the conventional method of loading files in the staging area. He sheds light on the potential attention points, highlighting crucial aspects to bear in mind during the append-only (insert-only) loading process.

For those grappling with the challenges of integrating CDC data seamlessly into the Raw Vault, Michael’s insights in this Data Vault Friday session provide valuable guidance and actionable tips.

Modelling Timesheet Data in Data Vault 2.0

Watch the Video

In the continued exploration of Data Vault concepts in our Data Vault Friday series, our CEO, Michael Olschimke, addresses a pertinent question from the audience concerning the integration of timesheet information into an internal Data Warehouse that already encompasses a Raw Vault for Resources, Projects, and Allocations.

“We are working on our internal Data Warehouse. We already have a Raw Vault for Resources (people in the organization), Projects, and Allocations (plans), but now we need to add the “timesheet” information. How should we model this, including the need to track changes?”

He provides actionable insights into structuring the Data Vault to accommodate timesheet data seamlessly, ensuring that historical changes are captured and enabling a robust system for tracking and managing timesheet-related information.

If you’re grappling with similar considerations in enhancing your internal Data Warehouse, Michael’s expertise in this Data Vault Friday session sheds light on best practices for modeling timesheet data within the broader Data Vault 2.0 architecture.

Typical Mistakes in Agile Approaches and How to Avoid Them

Watch the Webinar

In our webinar ‘Typical Mistakes in Agile Approaches’ we’ll explore the world of Agile Project Management, introducing Scrum as a powerful framework.

We’ll dive into the Data Vault 2.0 methodology for data integration in DWHs. Additionally, we’ll also discuss common mistakes when transitioning from Waterfall to agile approaches, including challenges specific to Data Vault and Scrum, offering practical guidance.

Join us to uncover common pitfalls and mistakes encountered in Agile Project Management and how to avoid them.

Watch Webinar Recording

Webinar Agenda

1. Get started with project management
2. Let’s get to know Scrum and agile project management and where are the pitfalls?
3. How does agile project management fits Data Vault 2.0?
4. How to avoid the Pitfall of not delivering business value

Seamless Agile Project Management in the BI Landscape

Agile project management has gained significant popularity in the corporate world due to its emphasis on collaboration, customer feedback, and continuous development. This approach has found its way into Business Intelligence (BI) projects, yet many companies still encounter common challenges or struggle to fully embrace agile methodologies.

A critical aspect of agile project management in BI involves effective collaboration among different teams. In today’s fast-paced business environment, projects often necessitate contributions from multiple departments or teams with diverse skill sets.
However, communication gaps, conflicting priorities, and differences in work styles can pose significant obstacles to smooth coordination and project success. Overcoming these challenges requires fostering open communication channels, establishing clear protocols for inter-team interactions, and cultivating a culture of mutual respect and understanding.

In the context of Data Vault and BI projects, several touchpoints demand collaboration from various departments or teams. For instance, gathering background information about the data source, ensuring privacy compliance, and obtaining well-defined user requirements are all critical components. Implementing well-defined processes, where everyone understands their responsibilities, can streamline these tasks. For example, ensuring privacy tagging precedes the implementation of the Raw Data Vault to ensure accurate Satellite splits. Additionally, clear requirements from users or reporting teams, in the form of User Stories or Question Stories, are fundamental for smooth project execution. In the following, you can visualize a high level example of an Development process of an Dashboard in a typical BI Project and the different Teams/People needed.

blank

Another common issue in BI projects is the excessive focus on technical aspects. Teams often dedicate significant time to building the entire technological infrastructure, neglecting the timely delivery of business value. At Scalefree, we advocate prioritizing business value from the project’s outset. We endorse the tracer bullet approach as an effective method, contingent on well-defined requirements. These issues are just a few examples of the challenges often faced in BI projects.


If you’re unfamiliar with the tracer bullet approach, don’t worry. We’ll dive into this topic and more in our webinar, “Typical Mistakes in Agile Approaches”. We also will take a look at Scrum and the Data Vault 2.0 methodology and uncover common mistakes in agile Project Management and learn how to avoid them. Watch the recording here for free!

OUR NEW MONTHLY EXPERT SESSION

To address the growing interest and challenges in agile project management, Scalefree is introducing “Insight Agile Projects,” a monthly expert session designed to address questions, share insights, and enhance collective knowledge in agile project management. Join us every 2nd Thursday of the month to gain valuable insights from our experienced project management experts, covering a range of topics including requirements analysis, effort estimation processes, stakeholder and people management, and their integration with the Data Vault 2.0 methodology.

Don’t miss the opportunity to enhance your project management proficiency with our expert guidance. Mark your calendars for the upcoming webinar and join our monthly expert sessions to gain invaluable insights into agile project management.

Close Menu