search
0

Was Machen BI-Berater:innen? Skills & Tasks

Watch the Webinar

Was macht ein Berater eigentlich? Es gibt viele Vorurteile und Mythen, die sich um den klassischen BI Berater ranken, aber stimmen sie auch?

In diesem Webinar lernt ihr wie der Job eines BI Beraters in der Praxis aussieht. Wir zeigen einen kompletten Werdegang vom Werkstudenten bis zum Senior Berater.

Watch Webinar Recording

Webinar Agenda

1. Kurzvorstellung Scalefree
2. Was machen Berater:innen?
3. Interview Werkstudent
4. Mein Weg als Berater
5. Interview Senior Beraterin

Implementing Data Vault 2.0 Zero Keys

Implementing Data Vault 2.0 Zero Keys

Learn about Zero Keys, “the other” concept that is oftentimes referenced interchangeably with ghost records, which we discussed in a previous blog post.

Why implement Zero Keys?

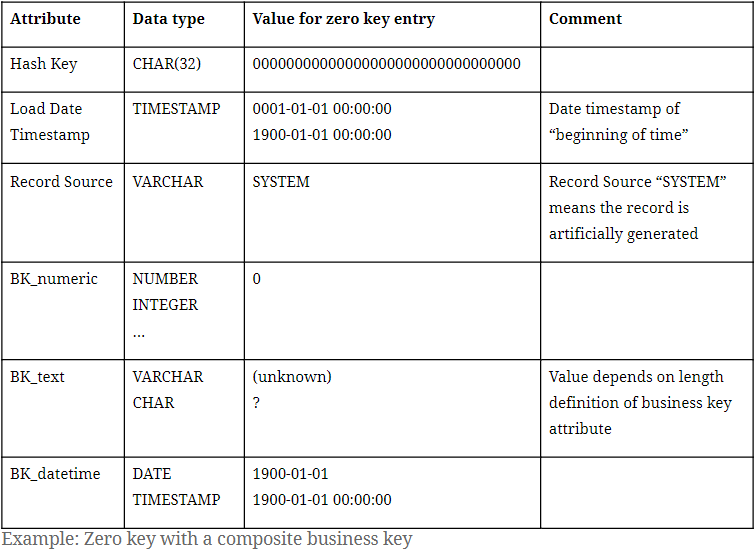
As discussed in the previous part of this series, a ghost record is a dummy record in satellite entities containing default values. Simply put, zero keys are the entry in each hub and link entity that is a counterpart to the satellite’s ghost record containing its hash key. In this manner, the term “zero key” is oftentimes used to describe the ghost record’s hash key, which might show up in other Data Vault entities such as in Point-in-Time (PIT) tables or links. Accompanying the zero hash key is, similar to a ghost record, a default value for the business key . Or, in the case of a composite business key, multiple default values for each of its components.

Zero Key with a composite business key

With the hub and link entry for the zero key in place, each and every entry in its related satellite will then have a parent hash key, avoiding so-called hash key orphans.

What does a Zero Key look like?

In Data Vault 2.0, it is only required to insert a single ghost record to each satellite entity. However, it is possible to have multiple zero keys in place. At Scalefree internally and in many  of our projects, we distinguish two types of missing objects through different hub zero keys.
Please note the hash algorithm in use is MD5:

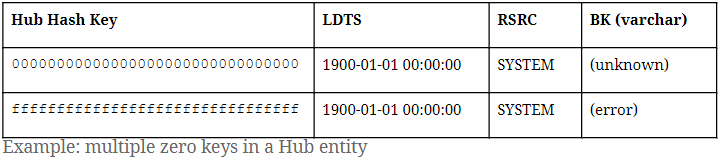
  • 00000000000000000000000000000000 (32 times the digit ‘0’) for general “unknown” cases where a business key is missing.
  • ffffffffffffffffffffffffffffffff (32 times the letter ‘f’): a dedicated zero key for “erroneous” cases of missing business keys that show.
Multiple zero keys in a Hub entity

A good example that calls for the “error” zero key is in an erroneous or broken mandatory object relationship in the source. In that case, the zero key ffffffffffffffffffffffffffffffff will be found in the link entity, indicating an unexpectedly absent hub reference. Bear in mind, should you choose to implement the error zero key, it is not required to insert a ghost record with the error zero key as a parent hash key in satellite entities.

As for the zero key in link entities, it is only necessary to have one entry containing the zero hash key as both link hash key and hub reference.

Zero key in a Link entity

It is also important to point out that all examples we provide in this blog series involve the hash algorithm MD5, which outputs 32-hexadecimal-digit sequences. For Data Vault 2.0 projects that adopt other hash algorithms, such as SHA256, simply adjust the length of the zero keys we proposed (“0000…” / “ffff…”) to the desired hash output length.

Conclusion

We hope that this blog post helped to clarify the implementation of zero keys in a Data Vault 2.0 solution and the differences between the concepts of ghost records and zero keys. Feel free to share your experience with implementing these concepts in the comments below!

Using Multi-Active Satellites the Correct Way – Part 2

Data Vault 2.0 Training FAQ - Customized Class

Multi-Active Satellites in Data Vault 2.0

In our first post about multi-active satellites, we briefly explained different implementations that can be used to solve multi-activity. Now, we’re going to go into more detail regarding the advantages and disadvantages of these approaches having delta checks on or off.


Short Summary of Multi-Active Satellites

Multi-active satellites allow you to implement multi-active records per business key in Data Vault 2.0. To illustrate the need for the solution, let’s look at the common occurrence of a source system that doesn’t provide the needed metadata such as when working with XML files.

One solution to the above is to create a multi-active satellite by adding a subsequence number per business key. This accounts for any instance in which there is no multi-active attribute delivered by the source itself. Regarding phone numbers, this information could be a tag for a business, home, or mobile phone number. Another possibility is to create an extra hub for the multi-active attribute. However, since it doesn’t present a real business object, the first solution can be more effective.

Delta Check OFF

There are two ways to insert new records into a multi-active satellite – having delta checks active or inactive. With delta checks turned off, all records of a business key are inserted into the satellite from your source delivery.

The advantage of that is that loads are faster and have a consistent load date timestamp to the parent hash key, independent of the multi-active attribute.

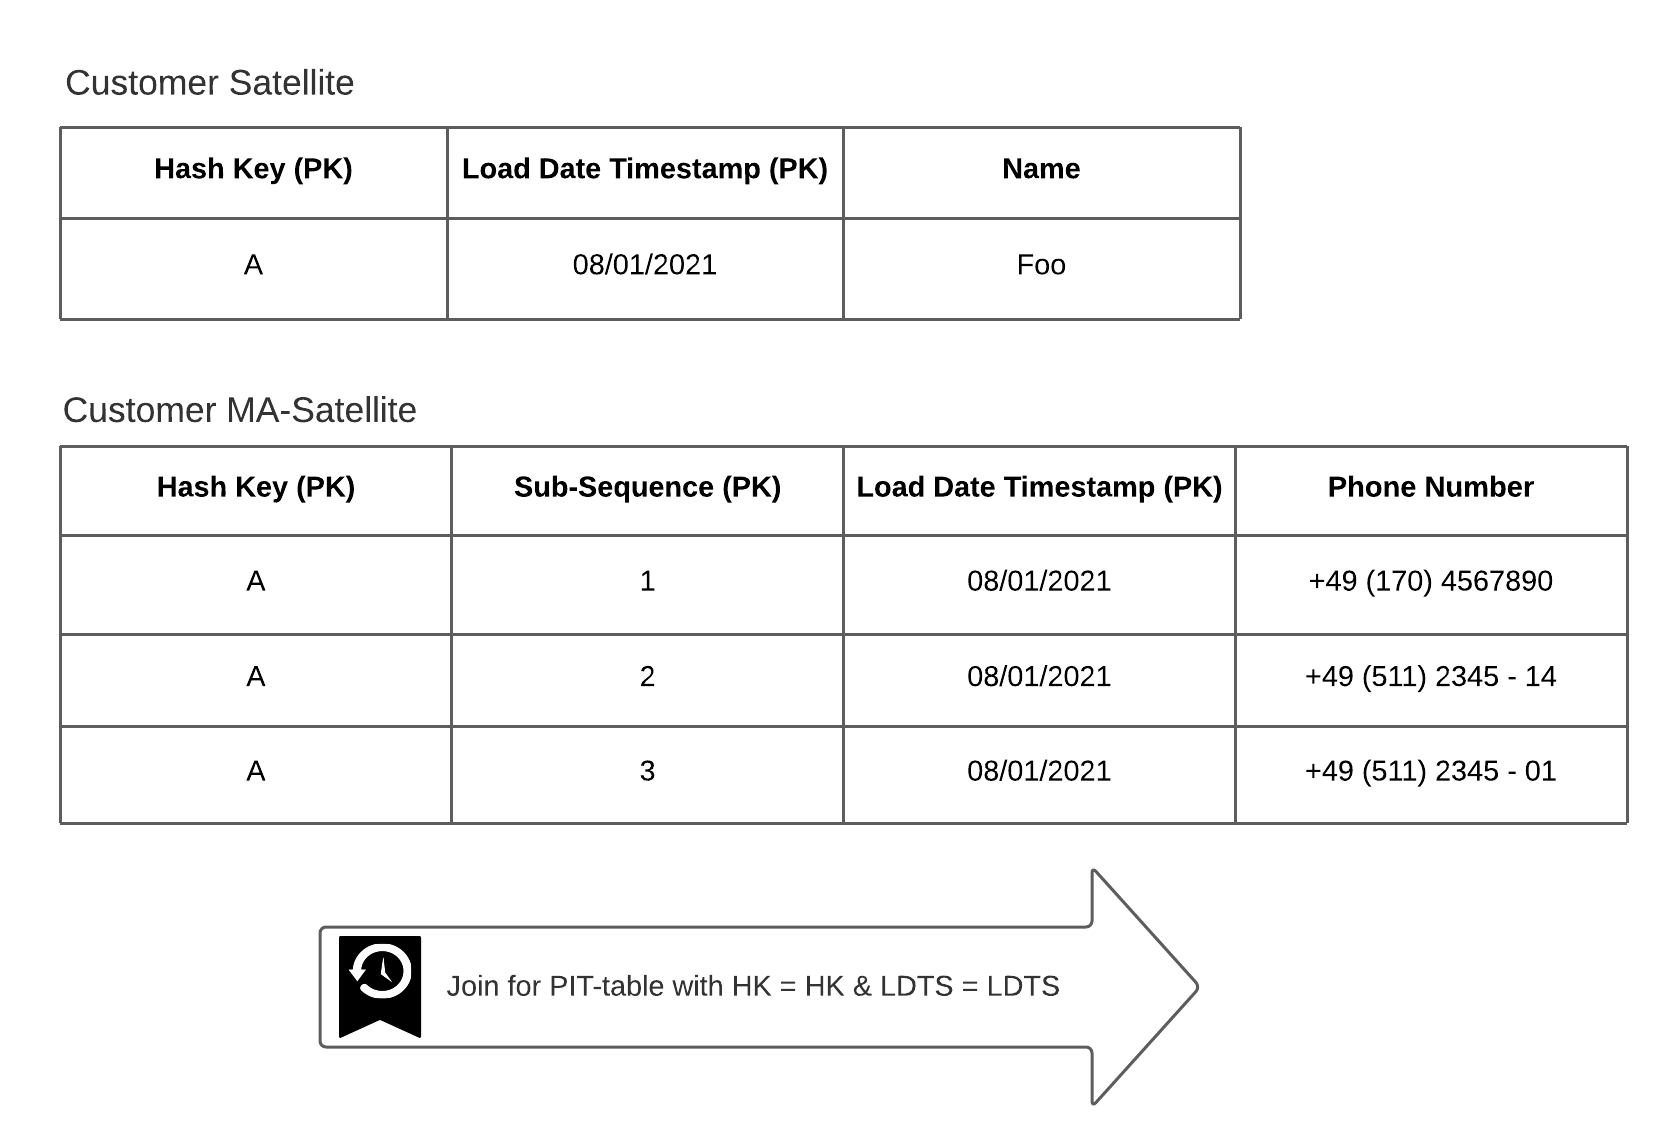
Later on, it simplifies the query based on the multi-active data (see Figure 1). As a critical drawback, the ingested amount of data can increase strongly if full data loads are received.

In this case, you should partition your data by the load date timestamp. 

Multi-active satellites

Figure 1: Joining records using one PIT-table when having one LDTS for all active records per key.

Delta Check ON

To reduce the amount of data simply use delta checks. Doing so, you match the incoming data with the latest LDTS per hash key.
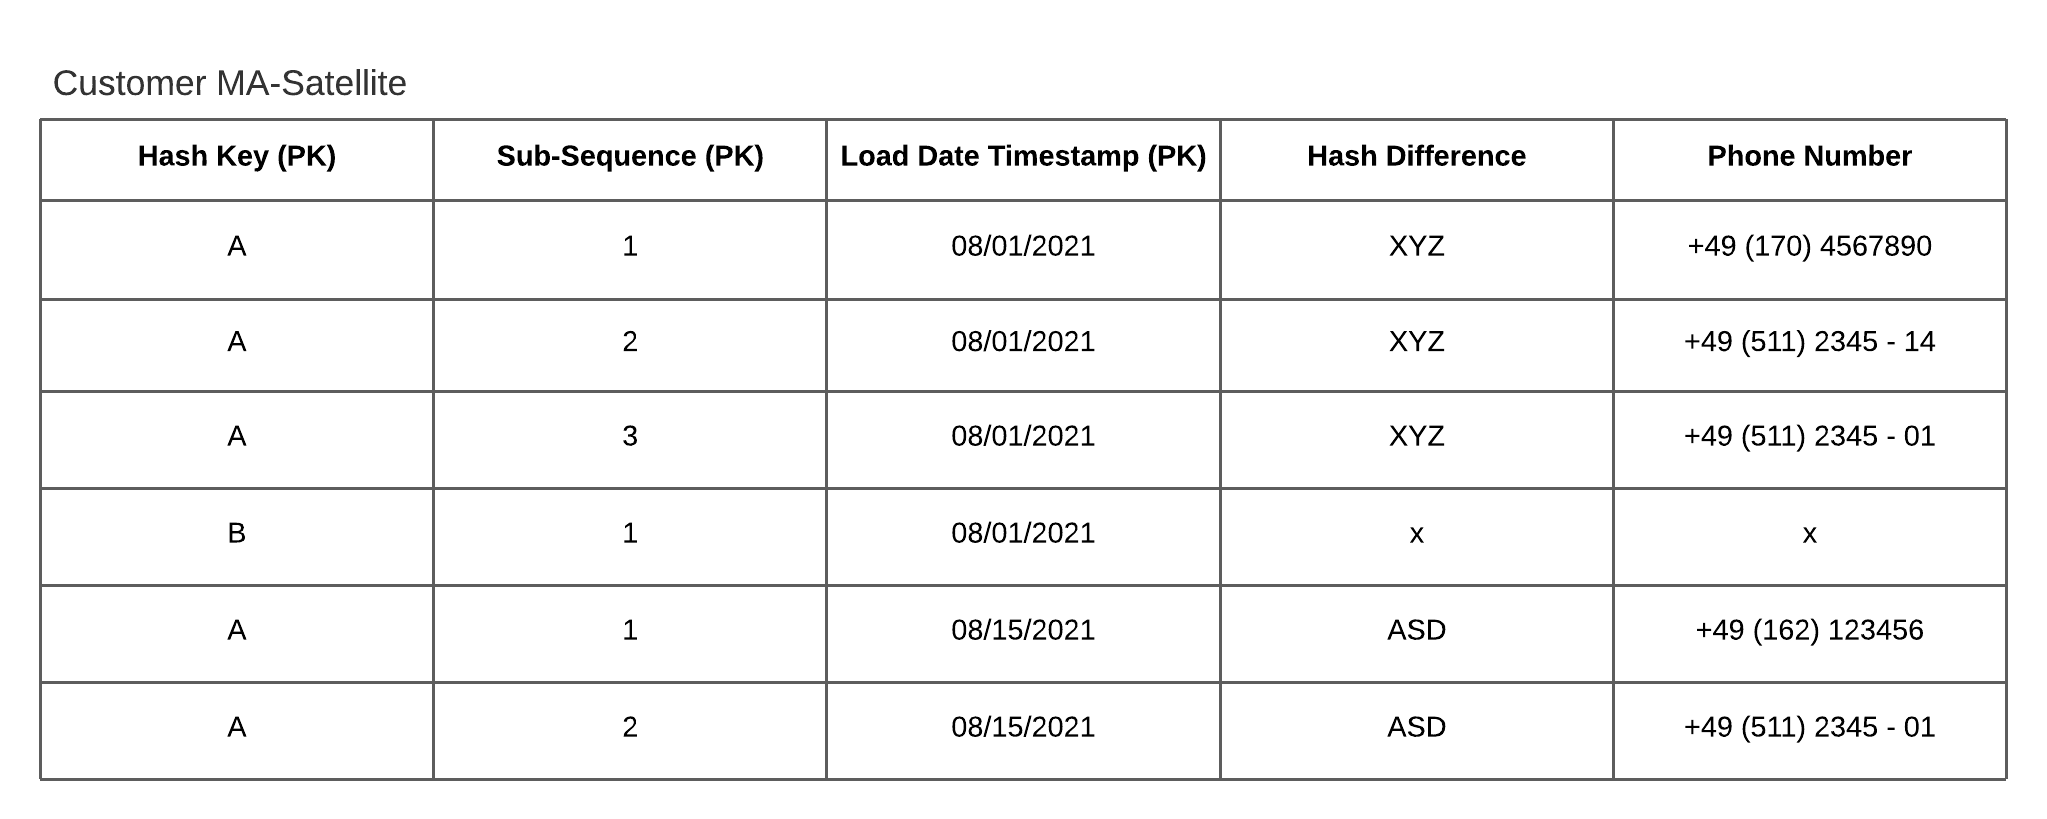
Note that a useful function to leverage the delta check is LISTAGG(). This function transforms values from a group of rows into a list of values. As a result, you are able to create a hash difference of multi-active attributes per business key (see figure 2).

Multi-active satellites

Figure 2 – Multi-row hash difference using the LISTAGG()-function

If new data arrives, it can be compared by the multi-row hash difference. Using it, a high proportion of data can be ignored. When a delta is detected, all records are inserted per hash key even if the content of the data for only one subsequence is changed. The result is that you get a consistent load date timestamp per hash key. Additionally, a delta is going to be noticed when the order of records changes as well. This approach is a trade-off to reduce the amount of records while still having a consistent load date timestamp per hash key so that only one PIT table is necessary.

Using Type Codes

Another method to address multi-activity is to use types of the attributes, granted they exist, as explained in the previous post.
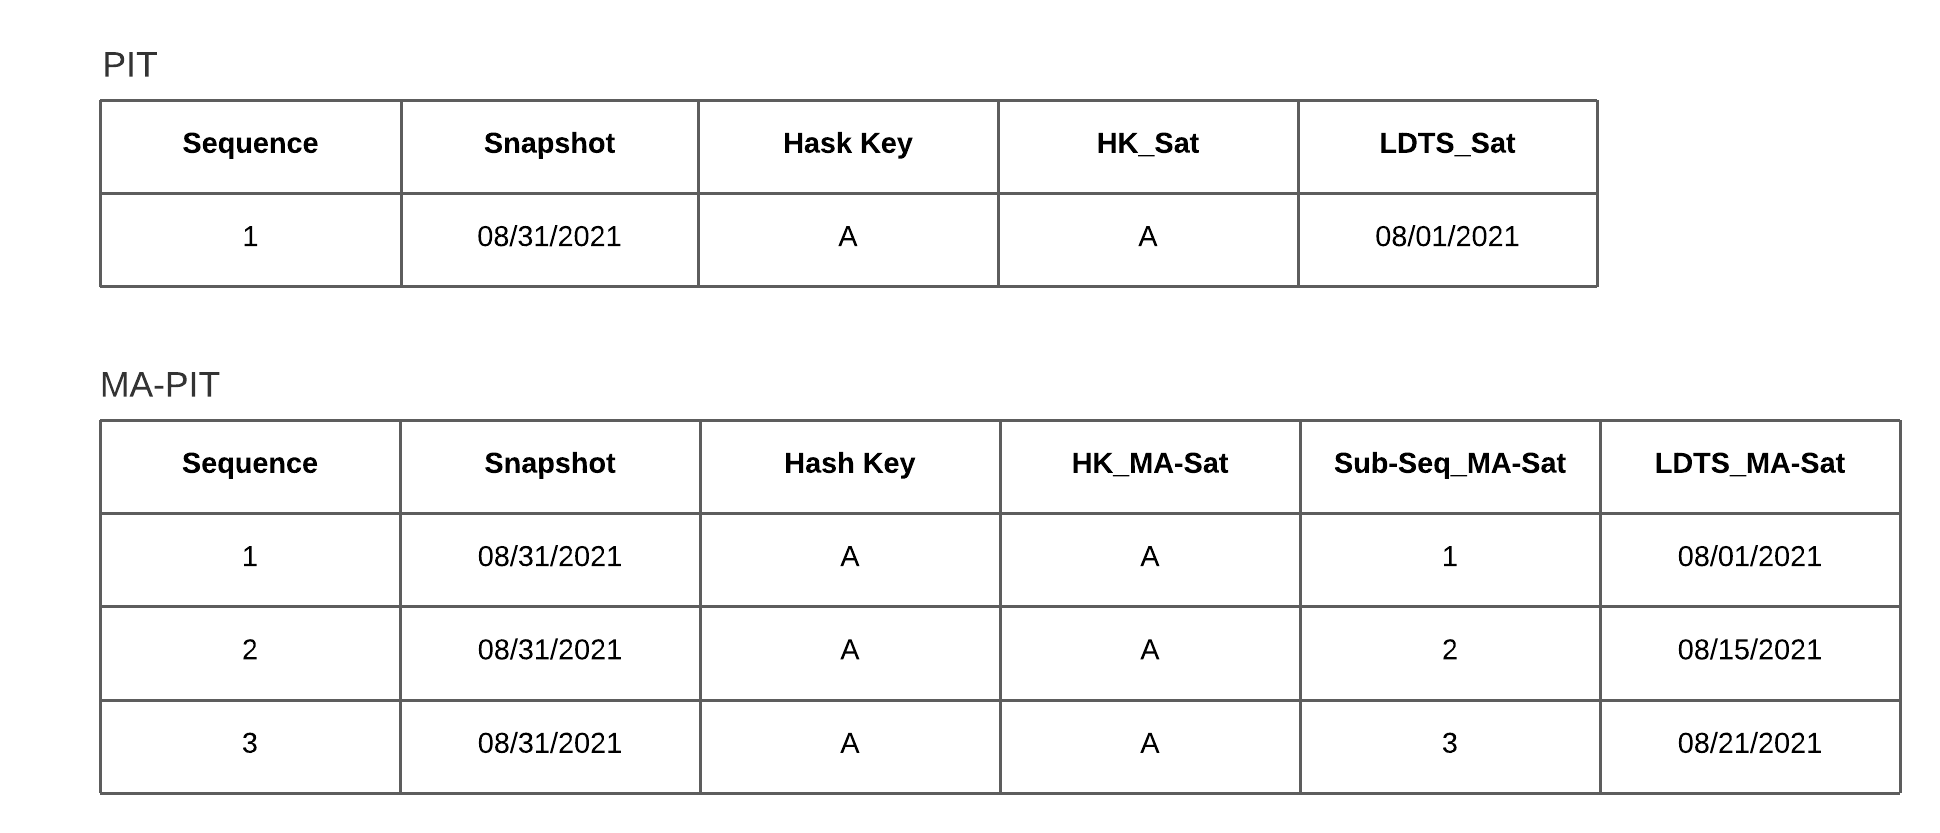
If you have type codes in place, you’re able to compare row by row and load only this specific data. But consequently, you get different LDTS per multi-active attribute. Using PIT-tables in the business vault, you’ll therefore need an extra multi-active PIT-table. This scenario is shown in figure 3.

Multi-active satellites

Figure 3 – The need for an MA-PIT having different LDTS of active records per key

If you can pivot the multi-active column into multiple columns, one column per characteristic, you won’t need to consider any of the above advantages or disadvantages. In this case, you turn the satellite into a standard satellite. Related to our example with the phone numbers, you would create a couple of new columns per phone type.
This solution is applicable if you can be certain that the characteristics of the phone types will not change in the future. Otherwise, you will have to reengineer your process to catch all the data you have delivered!

Conclusion

In our second post regarding  multi-active satellites, we explored the backgrounds behind the different methods. You can use this information to implement your own multi-active solution depending on your present data.
Though, note that it’s often recommended limiting the loading data. For this purpose, the LISTAGG()-function becomes useful. Using a solution with potentially different LDST, remember to consider them when querying the data.

Using Multi-Active Satellites the Correct Way – Part 1

Multi-Active Satellites in Data Vault 2.0

With multi-active satellites, you’re able to store multiple active records for one business key. Depending on how the data arrives from your source, there are different ways to implement multi-activity in Data Vault 2.0. In this post, we’ll explain your options for modeling. 

What are Multi-Active Satellites?

Multi-active satellites are similar to standard satellites and their structure. As said before, they store multiple active records per key at a point in time. This exact structure depends on the use case though.
See the example Data Vault model in Figure 1.

Continue Reading

Effort Estimation in Data Vault 2.0 Projects

Effort Estimation in Data Vault 2.0 Projects

In Data Vault 2.0 projects, we recommend estimating the effort by applying a Function Point Analysis (FPA), but there are many options available when choosing a method to estimate the necessary effort within agile IT projects. In this article, you will learn why FPA is a good choice and why you should consider using this method in your own Data Vault 2.0 projects.

Good Old Planning Poker for Effort Estimation

Probably the best known method for estimating work in agile projects is Planning Poker. Within the process, so-called story points, based upon the Fibonacci sequence (0, 0.5, 1, 2, 3, 5, 8, 13, 20, 40 and 100), are used to estimate the effort of a given task. To begin the process, the entire development team sits together as each member simultaneously assigns story points to each user story that they feel are appropriate. If the story points match, the final estimate is made. Alternatively, if a consensus cannot be reached the effort is discussed until a decision is made. 

However, it’s important to note that this technique involves a lot of effort as a result of either too many tasks or too many team members.  So the question is: Does Planning Poker work for Data Vault projects? The short answer is “it makes little sense”. Since in Data Vault 2.0 the functional requirements are broken down into small items, there are numerous tasks that all have to be discussed and evaluated. In addition, the subtasks in Data Vault 2.0 are standardized artifacts, such as Hub, Link, and Satellite. In principle, these artifacts always represent the same effort.

Why does Function Point Analysis suit it so well?

This is where FPA comes into play and the reason why it is widely used in agile software projects. The idea is that software consists of the following characteristics, which represent the Function Point Types:

  • External inputs (EI) → data entering the system
  • External outputs (EO), external inquiries EQ → data leaving the system one way or another
  • Internal logical files (ILF) → data manufactured and stored within the system
  • External interface files (EIF) → data maintained outside the system but necessary to perform the task

With FPA, you break the functionality into smaller items for better analysis. As mentioned, this is already done in Data Vault 2.0 projects due to the standardized artifacts. This is the reason why FPA is very suitable for Data Vault projects.

How to apply FPA in Data Vault 2.0

Hence, to make good use of FPA in the Data Vault 2.0 methodology, the functional characteristics of software, external inputs, external outputs, external inquiries, internal logical files, and external interface files, must be adapted to reflect Data Vault projects. The following functional characteristics of data warehouses built with Data Vault are defined as:

  • Stage load (EI)
  • Hub load (ILF)
  • Link load (ILF)
  • Satellite load (ILF)
  • Dimension load (ILF)
  • Fact load (ILF)
  • Report build (EO)

Please note that there are also other functional components that can be defined, like Business Vault entities, Point-in-time tables, and so on. Once you have defined these components, you should create a table that maps them to function points. Function points are used to quantify the amount of business functionality an element provides to a user. In general, it is recommended to add a complexity factor first:

Complexity Factor Person Hours per Function Point
Easy 0.1
Moderate 0.2
Difficult 0.7

Then use the complexity factors and the assigned function points per component to calculate the estimated hours needed to add the respective functionality. Here is a short example of how the mapping table could look like for you:

Component Complexity Factor Estimated Function Points Estimated Total Hours
Hub Load Easy 2 0.2
Dimension Load Difficult 3 2.1
Report Build Difficult 5 3.5

The goal of estimation is to standardize the development of operational information systems by making the effort more predictable. This is due to the fact that when you use a systematic approach to estimate the needed effort to add components, it is possible to compare the estimated values with the actual values once the functionality is delivered. When both values are compared, your team can learn from these previous estimates and improve their future estimates by adjusting the function points per component. Also, keep in mind that your developers will gain experience over time or might lose experience due to replacement.

Conclusion

I hope this first glimpse into FPA helps you understand the basic value it can provide your team in Data Vault 2.0 projects. You can have a more in-depth look at how to apply FPA in Data Vault 2.0 projects by reading the book “Building a Scalable Data Warehouse with Data Vault 2.0” by Michael Olschimke and Dan Lindstedt.


Implementing Data Vault 2.0 Ghost Records

Ghost records

Implementing Data Vault 2.0 ghost records

During the development of Data Vault, from the first iteration to its latest Data Vault 2.0, we’ve mentioned the two terms “ghost records” and “zero keys” in our literature as well as in our Data Vault 2.0 Boot Camps. And since then, we’ve noticed these concepts oftentimes being referenced interchangeably. 

In this blog entry, we’ll discuss the implementation of ghost records in Data Vault 2.0. Please note, that this article is part one of a multi-part blog series clarifying Ghost Records vs. Zero Keys.


Why implement ghost records?

The concept of ghost records is usually brought up together with the implementation of point-in-time (PIT) tables. PIT tables are used as query assistant objects as part of the Business Vault, in which snapshots of data are created for certain time intervals specified by the data consumers. It’s important to note that these intervals can be daily, weekly, even real-time, etc. Each entry in a PIT table materializes joins from a Data Vault spine object (either a Hub or a Link) to its surrounding Satellite structures to reduce joins while querying against the Data Vault and thus boosting query performance.

In some instances, however, upon joining e.g. a Hub to one of its Satellites, there can be no corresponding Satellite delta for certain snapshots. The reason behind this could be that the business key was not available or unknown by the data source at that given time. 

Ghost records

Reference to a ghost record in a PIT table

To combat this issue, ghost records are added to Satellite entities to virtually fill up gaps in the beginning of the timeline, so that equal joins are made possible in ad-hoc queries against the Raw Vault. Equal joins (a.k.a. equi-joins) are joins that only use equality comparators and are arguably the most efficient/fastest SQL-join type.

What does a ghost record look like?

A ghost record can be understood as a dummy record that contains default values. In the previous iteration of Data Vault (DV1), the solution was to create a ghost record per key per satellite structure. This would still do the job of filling up gaps at the beginning of the timeline. However, this solution didn’t scale well on higher volumes of data. Imagine a hub that contains 10 million business keys and there are three satellites attached to it. Every satellite then contains 10 million ghost records, resulting in 30 million records across all three satellites. In addition, every time a business key is added to the hub, a corresponding ghost record needs to be added to each satellite. The sheer amount of ghost records in this case would defeat the whole purpose of trying to achieve equi-joins, to enable faster queries. 

Thus, since the introduction of DV2.0, it is only required to insert one single ghost record per Satellite structure.

Ghost records

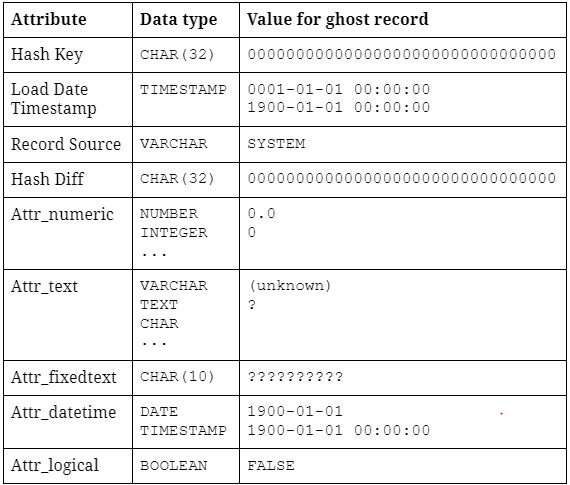
Example: Ghost record with attributes of different data types

The ghost record typically contains a constant hash key 00000000000000000000000000000000 (32 times the character “0”). This hash key is also known as a Zero key – more on Zero keys coming up in the next part of this blog series. Its load timestamp is usually set to the earliest possible timestamp within the DBMS, indicating the “beginning point of time”. The record source “SYSTEM” simply means the record is artificially generated. 

Then, follows a list of default NULL values for every descriptive attribute within the Satellite structure. For each data type, we define a default value for the ghost record. For example, attributes with numeric data types can be filled with (numeric) zero, string attributes can be filled with either “(unknown)” or “?” depending on the length definition of the attribute.

It is recommended that the ghost record is filled with default values, as opposed to filling it with NULL/empty values, since these default values can be used and displayed further downstream. A good example of this can be seen in dimensions, an “(unknown)” string is arguably way more descriptive than a mere NULL value.

How to insert ghost records

There are a couple of ways to insert ghost records into Satellite structures.

The first variation is to insert the ghost records upon object creation as a one-time operation and then forget about it. Simple as that!

Another way is to insert the ghost record during the process of loading Satellites. The loading procedure should start with inserting a ghost record into the target object, if it does not yet exist. Then, the procedure can proceed with loading the Satellite with incoming data as normal. This variation might be viewed as rather excessive. However, it ensures that the ghost record is always available and that it gets inserted back into each Satellite – in case for whatever reason, objects are truncated or the ghost record itself is accidentally deleted, for example during development.

Both variations can be fully automated within your project’s Data Vault automation tool of choice.

Conclusion

We hope that this blog post helps to clarify the implementation of ghost records in a Data Vault 2.0 solution. Coming up next, we’d like to discuss with you “the-other-technical-term” Zero keys and the difference between Ghost records and them – which has been rather confusing to many fellow Data Vault practitioners.

Data-Driven Decision Making – For Power Users and Data Scientists

Watch the Webinar

In this webinar, Michael Olschimke, the CEO of Scalefree, presents how to gain additional advantage from the enterprise data warehouse by making the solution available to power users and data scientists.

No one likes to wait! If you have to wait too long for data or information, you will find another way to get what you need. This will end up in different inconsistent data warehouse “solutions” in your company.

To avoid this, an agile approach with managed Self-Service BI is essential to keep a good relationship with Power Users (e.g. Data Scientists) and to build a governed enterprise BI solution for better decision-making. In this webinar, Michael Olschimke will talk about approaches, best practices, and experiences.

Watch Webinar Recording

Webinar Agenda

1. About Data-Driven Organizations
2. Creating a Data-Driven Strategy
3. Making Data Available throughout the Enterprise

About Non-Functional Requirements

Non-Functional Requirements in Data Warehousing

The enterprise data warehouse is more than just reports and dashboards. There are actually more technical components, also know as non-functional requirements, to be built.

Why Non-Functional Requirements are important

In our trainings and consulting practice, we often pitch the idea of “focusing on the business value” to the audience. Business value in enterprise data warehousing is defined as “something of value to the business” (believe it or not, we believe it should be said sometimes).

Typically, the reason businesses setup a budget for the enterprise data warehouse is that they want some reports or dashboards with actionable information. On the other hand, the most important counter-argument is that the enterprise data warehouse is more than just reports and dashboards. There is actually a lot of more technical components (non-functional requirements) to be built, including but not limited to: Continue Reading

Organization of Information Requirements

Just a Recommendation…how we Organize our Information Requirements


Information is required by business users throughout the industry. However, as part of our consulting engagements, we also encounter a lack of proper description as to what the business user actually needs. 

So, we want to use this article to present the way we structure our information requirements internally at Scalefree as well as the way we do so for many of our customers.

What about User Stories?

We all know user stories from Scrum and many business intelligence projects.
Their structure is typically something that looks like:

As a <type of user>, I want <some goal> so that <some reason>.

The following example represents a typical user story we would receive in a project:

As a <marketing user>, I want <to have an overview report with the number of leads from a marketing channel> so that <I can adjust the marketing budget accordingly>.

Now, what should we do with this user story?
Many details are missing, and yes, we all know about product backlog refinement. The problem is that the user story is just not sufficient enough within business intelligence efforts and some structure might be of help.

Information Requirements

Developers in enterprise data warehousing and business intelligence need much more detail than just the user story. On the other hand, the user story is a good starting point for the information requirement. So, it can be treated as a typical introduction. The overall structure looks like this:
Continue Reading

About Information Marts in Data Vault 2.0 – Part 1

Information Marts in Data Vault 2.0

In the Data Vault 2.0 architecture, information marts are used to deliver information to the end-users. Conceptually, an information mart follows the same definition as a data mart in legacy data warehousing. However, in legacy data warehousing, a data mart is used to deliver useful information, not raw data. This is why the data mart has been renamed in Data Vault 2.0 to better reflect the use case.


Introduction to Information Marts

However, the definition of information marts has more facets. In the book “Building a Scalable Data Warehouse with Data Vault 2.0” we present three types of marts:

  • Information marts: used to deliver information to business users, typically via dashboards and reports.
  • Metrics Mart: used in conjunction with a Metrics Vault, which captures EDW log data in a Data Vault model. The Metrics Mart is derived from the Metrics Vault to present the metrics in order to analyze performance bottlenecks or resource consumption of power users and data scientists in managed self-service BI solutions.
  • Error Mart: stores those records that typically fail a hard rule when loading the data into the enterprise data warehouse.

Information Marts for Consulting

In addition to these “classical” information marts, we use additional ones in our consulting practice:

  • Interface Mart: this is more or less an information mart, however, the information is not delivered to a human being, e.g. via a dashboard or report. Instead, it is delivered to a subsequent application or, as a write-back, to the source system (for example when using the enterprise data warehouse for data cleansing).
  • Quality Mart: the quality mart is again an information mart, but instead of cleansing bad data, it is used to report bad data. Essentially, it turns the business logic used to cleanse bad data upside down: only bad data (well and ugly data sometimes) is delivered to the end-user, the data steward. This is often done in conjunction with data cleansing frontends where the data steward can either correct source data or comment and tag the exceptions.
  • Source Mart: again an information mart, but this time not using one of the popular schemas, such as star schemas, snowflake schemas, or fully denormalized schemas. Instead, the information mart uses the data model of the source application, similar to an operational data store (ODS) schema. However, the Source Mart is not a copy of the data, it is a virtualized model on top of the Data Vault model, reflecting the original structures. It is great for ad-hoc reporting and of great value for many data scientists and power users.

This concludes our list of information marts. We have used them successfully in projects for our clients to better communicate the actual application of the information marts in their organization.

Conclusion

Information marts in Data Vault 2.0 are essential for delivering processed data to end-users through reports and dashboards. Variants like Metrics Marts and Error Marts enhance performance analysis and data quality management. Additionally, specialized marts such as Interface, Quality, and Source Marts cater to specific business needs, ensuring flexible and efficient data delivery.

Granularities of Business Vault Entities

The Business Vault is the layer in the Data Vault 2.0 architecture where business logic is implemented to transform, cleanse and modify the data.

The book “Building a Scalable Data Warehouse with Data Vault 2.0” by Scalefree’s founders Dan Linstedt and Michael Olschimke and the Data Vault 2.0 Boot Camp shows how to implement such business logic using various Business Vault entities, such as computed satellites.

However, it is worth to note that this is only half the story, half the knowledge. The book shows computed satellites (and other entities) with a load date in the primary key of the computed satellite. Such satellites are great for capturing the results from business logic that is applied on the incoming deltas. However, there are two different types of granularities for business logic in the Business Vault: Continue Reading

Data Warehousing and Why We Need It

Data Warehousing

A data warehouse is a subject oriented, nonvolatile, integrated, time variant collection of data to support management’s decisions
Inmon, W. H. (2005). Building the Data Warehouse. Indianapolis, Ind.: Wiley.

Data Warehousing provides the infrastructure needed to run Business Intelligence effectively. Its purpose is to integrate data from different data sources and to provide a historicised database. Through a DWH, consistent and reliable reporting can be ensured. A standardized view of the data can prevent interpretation errors, improved data quality and leads to better decision-making. Furthermore, the historization of data offers additional analysis possibilities and leads to (complete) auditability. 

Data Warehousing – Why we need it

This webinar delves into how a data warehouse integrates data from various sources to support business intelligence by providing a centralized, historical database. This integration ensures consistent and reliable reporting, improves data quality, and facilitates better decision-making. Additionally, maintaining historical data enables comprehensive analysis and complete auditability.

Watch webinar recording

Why do we need Data Warehousing?

“Why do we need data warehousing for reporting, we have excel sheets?!”

Yes, excel is a great tool… to use and lose control over  your data as well as your reports.

You can report directly from a data source but you are massively limited in functionality and governance. Furthermore, you can only generate reports from one source system and don’t have a delta-driven history of your data. By creating reports directly from the source system and storing them on a local pc you lose track of which user pulled the data, as well as at what time, to build the report. Thus, the reports are no longer reliable. To prevent this, data warehousing comes into play.

Let’s imagine our goal is to build a sales revenue dashboard based on a timeline, a customer group, your products and regions. Without a DWH you have to collect all data manually from all necessary source systems. This data is most likely a mix of structured, unstructured and semi structured data. The challenge then becomes how to prepare and visualise the data in addition to creating an easily repeatable method of doing so. This is very time-consuming and can be very costly.
By the time all data is collected and prepared, the data may already be out of date causing the need to start again. 

With a DWH, all data is collected at one single point. The Data is aligned to the business (integrated & subject-oriented) with standardised definitions e.g. of KPI’s so that every report interprets the data equally. The access to the DWH is  read only (non-volatile), once loaded you can’t change the data (auditable). This leads to a complete historization of the data (time variant). With all data available, the needs of the users can be satisfied (structured data, integrated by business terms). For business users, there is also the option of using Self-Service BI.

What about a Data Lake?

As the “data lake” was introduced a couple of years ago, there was the assumption that it would replace a data warehouse.
A data lake is a great environment when used as a first landing zone for your data in your IT infrastructure but it does not “integrate” the data as a data warehouse does.
A data lake can be used to process the data further downstream into your data warehouse and an information delivery area. Structure becomes very important at this point so that your data lake doesn’t turn into a data dump and you are always able to query the data you need in an easy way.

To this end, you must create an architectural design dependent upon how you process the data from your data lake into your data warehouse. This could also happen in a completely virtualized way, depending on the amount of data as well as respectively the performance necessary to process the data towards the point of the end-users.

A data lake is also a good place for data scientists to gain access to the data as soon as possible, even if it is the native format. For end users who are working with structural data for reporting, dashboarding and analysis purposes, a structured, integrated, well-performing and easy-to-access data warehouse is necessary to fulfil their requirements. They expect the data in a prepared information mart, like a star schema or a flat and wide table.

Conclusion: If you want to use a data lake, think about how you need and process the data on the way out so that you can create a suitable structure for it. If you don’t need your data integrated, subject-oriented and time-variant, then you may be fine with a data lake only. But if you need all these great properties, you definitely need a data warehouse.

How does Data Warehousing work?

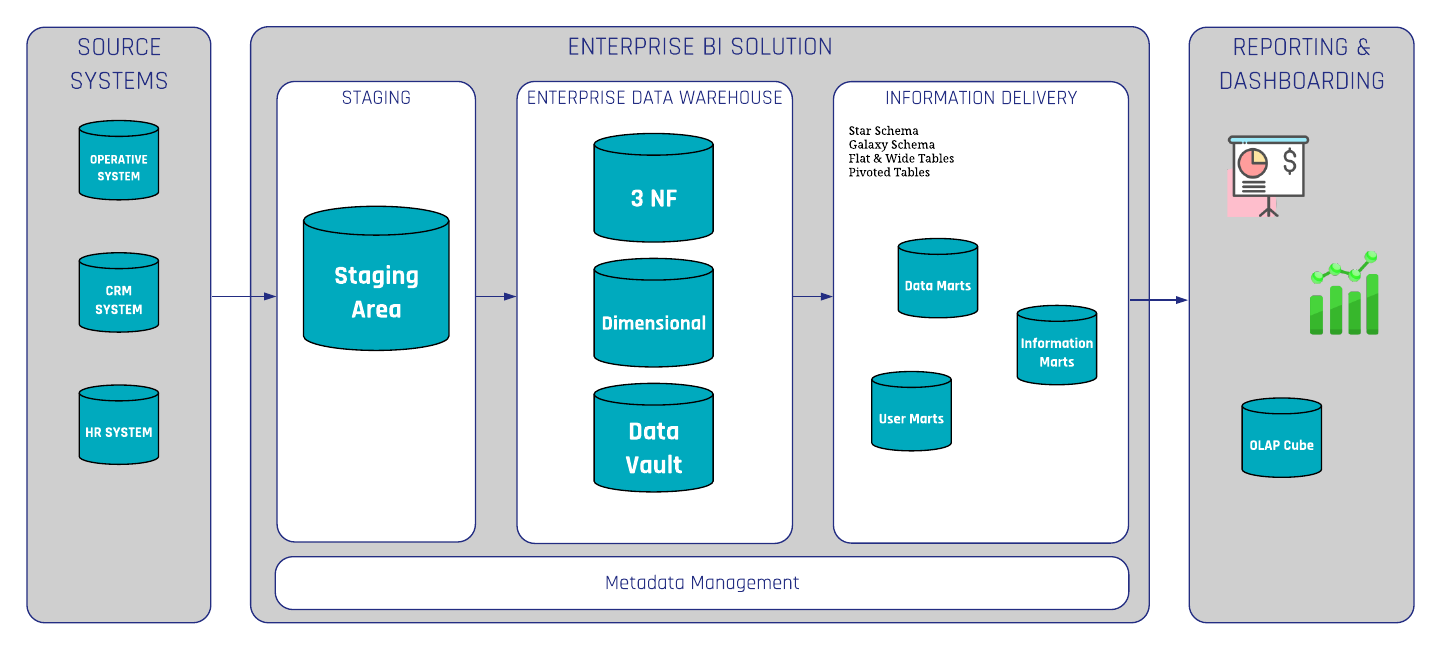
It starts with the ETL process (extract, transform, and load) in which the data is extracted from the source system into your  technical environment / (DWH infrastructure)  called the “Staging Area”. After extracting all data from the source system, you integrate your data into a subject oriented structure. The result is an Enterprise Data Warehouse (EDW) which provides data and information about how the end user needs it.

There are several modeling techniques available to build a data warehouse. 3NF (third normal form) was invented by Bill Inmon and is also known as the top-down approach. Alternatively, Dimensional Modeling by Kimball is more aligned to the business processes (bottom-up approach). Data Vault 2.0  is a hybrid between 3NF and dimensional modeling invented by Dan Linstedt. At Scalefree, we specialize in Data Vault 2.0 modeling.

Data Warehousing Reference Architecture

Conclusion

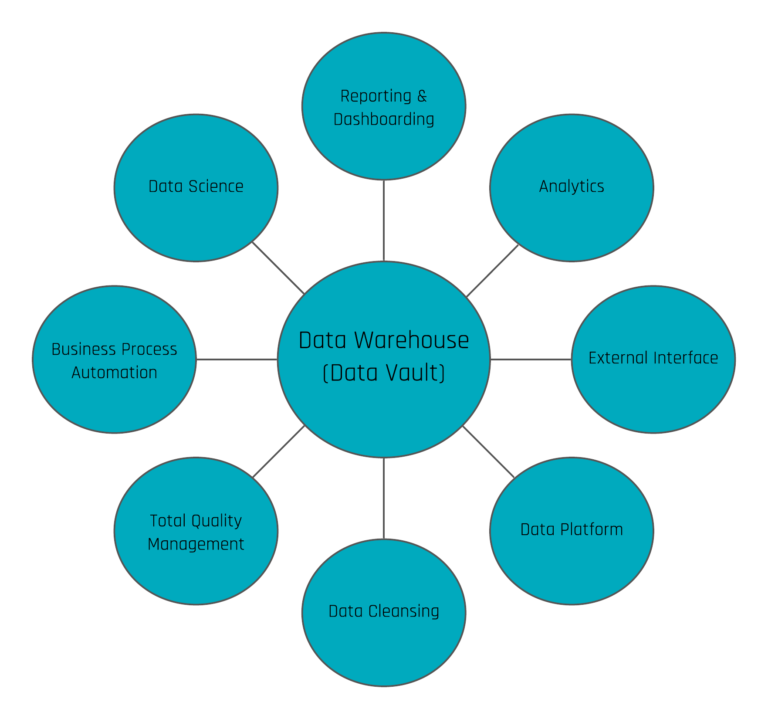
When only utilizing this single aspect of an EDW, users are missing opportunities to take advantage of their data by limiting the EDW to such basic use cases. A variety of use cases can be realized by using the data warehouse, e.g. to optimize and automate operational processes, predict the future, push data back to operational systems as a new input or to trigger events outside the data warehouse, to simply explore but a few new opportunities available.

Data Warehousing Use cases

Data Vault 2.0 Use Cases

Data warehousing is ideal for centrally storing all internal and external data sources. The standardization of structured, unstructured, and semi-structured data enables faster and more reliable reporting. Historization allows additional reports and past reports can be reconstructed at any time. With the flexibility of Data Vault 2.0, organizations can apply new capabilities, which go beyond just standard reporting and dashboarding.

If you want to learn more about Data Vault 2.0 Use Cases and the latest technologies from the market, we offer a broad range of free knowledge on our blog/newsletter and webinars. Feel free to sign up for regular updates.

Close Menu