

search
0

Data Vault Link Effectivity

Link Effectivity

One of the most common — and most misunderstood — challenges in Data Vault modeling is how to correctly handle changing relationships. Especially when source systems insert, delete, and even reinsert the same records over time, many teams struggle to answer a simple but critical question:

“How do I reliably determine the latest valid state of a relationship?”

In this article, we will walk through exactly how to model this scenario using Links and Effectivity Satellites in Data Vault, why this pattern is essential, and how it allows you to extract both the current and historical state of relationships in a clean, auditable way.


The Scenario: A Source Table with Changing Relationships

Let’s start by restating the problem in simple terms.

You have a source table with the following structure:

  • COL_1 + COL_2 → Business Key for Hub A
  • COL_3 + COL_4 → Business Key for Hub B
  • COL_5, COL_6 → Descriptive attributes
  • ROW_OPERATION → Insert / Delete indicator

This tells us something important right away:

  • Two business keys appear in the same row
  • Therefore, there is a relationship between those business keys
  • That relationship belongs in a Link

The complexity arises because the operational system:

  • Inserts records
  • Deletes records
  • Sometimes reinserts the exact same records later

All while the actual business keys and attributes remain unchanged.

So how do we model this in a way that preserves history, supports auditing, and still lets us easily answer:

“Which relationships are valid right now?”

Why Links Alone Are Not Enough

In Data Vault, a Link represents the existence of a relationship — not its state.

Once a relationship between Hub A and Hub B exists, the Link record itself is immutable.
It simply tells us:

“At some point in time, this relationship existed.”

But the Link alone cannot tell us:

  • When the relationship became active
  • When it was removed
  • When it was reintroduced

This is where many implementations go wrong. Teams try to encode relationship state directly into the Link or manage it downstream in reporting logic. Neither approach scales, and both break Data Vault principles.

The correct solution is to model the effectivity of the relationship separately.

Enter the Effectivity Satellite

An Effectivity Satellite attached to a Link tracks the physical existence of that relationship over time.

Think of it as a timeline that answers one simple question:

“Is this relationship active or inactive at a given point in time?”

Typical Structure of a Link Effectivity Satellite

  • Link Hash Key
  • Load Date Timestamp (LDTS)
  • Record Source
  • Deletion Timestamp

The deletion timestamp is the key attribute. It defines until when a relationship is considered active.

A common and proven pattern is:

  • Active relationship → Deletion date = 8888-12-31
  • Inactive relationship → Deletion date = actual load timestamp when deletion was detected

(Using 8888-12-31 instead of 9999-12-31 avoids date overflow issues and is widely adopted in practice.)

Walking Through the Lifecycle of a Relationship

Let’s walk through the example step by step.

Day 1: Relationship Is Inserted

The source system delivers a row linking business keys A and B.

  • A Link record (A–B) is created if it does not yet exist
  • An Effectivity Satellite record is inserted
Deletion_Timestamp = 8888-12-31

This means: the relationship is active.

Day 2: Relationship Is Deleted

The source system no longer contains the A–B row.

We do not delete the Link. Instead:

  • A new Effectivity Satellite record is inserted
  • The deletion timestamp is set to the current load timestamp

Now the timeline clearly shows when the relationship ended.

Day 3: Relationship Is Reinserted

The same A–B relationship appears again in the source.

Important point:

  • The Link already exists → no new Link row
  • The Effectivity Satellite needs a new delta
Deletion_Timestamp = 8888-12-31

This marks the relationship as active again — without losing the history of the previous deletion.

Handling Updates: Why Updates Are Two Events

Another area where teams often struggle is updates.

In Data Vault terms:

An update is a deletion of the old version and an insertion of a new version.

For example, if a relationship changes from A–B to A–C:

  • A–C is inserted as a new Link relationship
  • The Effectivity Satellite marks A–C as active
  • The Effectivity Satellite marks A–B as deleted

This ensures that:

  • No ambiguity exists about which relationship is active
  • Historical reporting remains accurate
  • Auditors can trace every change

How to Query the Latest Valid State

Once modeled correctly, querying the current state becomes straightforward.

Current Active Relationships

  1. Join the Link to its Effectivity Satellite
  2. Select the latest satellite record per Link hash key
  3. Filter where Deletion_Timestamp = 8888-12-31

That’s it.

This pattern works consistently across:

  • Current-state reporting
  • Type 1 dimensions
  • Snapshot-based reporting using PIT tables

What About ROW_OPERATION and Valid-From / Valid-To?

It’s important to clearly separate concepts:

ROW_OPERATION

Indicators like Insert/Delete from the source system are:

  • Descriptive metadata
  • Useful for loading logic
  • Not the source of truth for effectivity timelines

They can be stored in a descriptive Satellite, but effectivity is driven by load detection.

Valid-From / Valid-To

Business validity dates are not deletion timelines.

  • They describe business meaning (contracts, subscriptions, agreements)
  • They belong in separate descriptive Satellites
  • They are typically applied in the Business Vault or downstream

Mixing business timelines with technical effectivity is a common modeling mistake.

Why Effectivity Satellites Are Not Optional

A final, often overlooked argument: dirty data.

What happens if:

  • A relationship is accidentally loaded
  • Used in reports
  • Then later corrected or removed

Without an Effectivity Satellite:

  • You cannot explain historical results
  • You cannot prove when data changed
  • You cannot support audit requirements

That’s why, in real-world Data Vault implementations:

  • Most standard Links have Effectivity Satellites
  • Most Hubs have them as well
  • Only a few special cases are exceptions

Key Takeaways

  • Links capture existence, not state
  • Effectivity Satellites capture when relationships are active
  • Deletes and reinserts are modeled as satellite deltas
  • Updates are modeled as delete + insert
  • Current state is derived by filtering on open deletion timelines

Once you adopt this pattern consistently, handling complex relationship lifecycles becomes simple, scalable, and auditable.

Watch the Video

How to Build Data Vault Satellites in Coalesce.io

Data Vault Satellite in Coalesce.io

Building Data Vault structures can feel complex when you first begin working with them, especially when implementing them inside a modern transformation platform such as Coalesce.io. In today’s article, we will walk through the full lifecycle of creating Satellites, from source data to stage layers, hash key generation, private and non-private satellites, and finally V1 satellites that support historization and Data Vault 2.0 best practices.

This guide is based on a hands-on demo scenario using supplier data. The goal is not only to show you how to technically create satellites in Coalesce.io but also to explain why these steps matter and how they fit into the larger Data Vault methodology.


Why Satellites Matter in Data Vault Modeling

In Data Vault, satellites store descriptive attributes about business entities. They sit alongside hubs and links, extending these structures with the contextual information that typically changes over time. Because descriptive data can evolve—names, addresses, account balances, and other attributes—satellites allow us to capture the full history of changes while keeping hubs and links stable and lean.

A typical Data Vault satellite includes:

  • A hub hash key to tie satellite rows to a business key
  • A hash diff to detect attribute changes
  • Descriptive attributes such as names or phone numbers
  • Load timestamps and record source metadata
  • Optional historization fields such as load end date timestamps and an is_current flag

Coalesce.io makes it easier to generate these components through its Data Vault package. The platform handles much of the boilerplate SQL, letting you focus on modeling rather than syntax.

Understanding the Supplier Data Example

In the example used throughout the demo, our source system provides several fields:

  • Supplier key (a numerical unique identifier)
  • Name
  • Address
  • Nation key (used in links)
  • Phone number
  • Account balance
  • Comments

To keep things realistic, imagine the name and address values contain personal identifiable information. Because Data Vault supports privacy-aware modeling, we split the satellite into:

  • A private satellite for sensitive fields like name and address
  • A non-private satellite containing the remaining descriptive data

Separating data in this way supports compliance, access control, and sensitive-data masking—common requirements in real-world deployments.

Step 1: Building the Stage Layer

Before building satellites, we must create a stage table in Coalesce. The stage prepares the data for Data Vault modeling by generating the hash keys and hash diffs we will need later.

Inside Coalesce, we right-click the supplier source node and select Add Node → Stage. The purpose of this stage is to normalize the structure and add the necessary technical metadata.

What we generate in the stage:

  • Hub Hash Key (HK_Supplier): created from the Supplier Key
  • Hash Diff for Private Satellite: created from Name and Address
  • Hash Diff for Non-Private Satellite: created from Phone, Account Balance, and Comment
  • Load Date Timestamp: represents when the data was loaded
  • Record Source: tracks where the data came from

After saving and creating the stage node, Coalesce generates a view containing all the original source data plus the new hash fields and technical metadata. This prepares us to build the satellites cleanly and consistently.

Step 2: Creating the Private Satellite (V0)

Next, we right-click the stage and add a new node, selecting the V0 Satellite from the Data Vault package. This satellite will contain only the sensitive columns.

Private satellite includes:

  • Hub hash key
  • Private hash diff (Name + Address)
  • Name
  • Address
  • Load Date Timestamp
  • Record Source

We remove the non-private columns and keep only what belongs to the private satellite. After configuring the node properties and Data Vault options, we create and run the satellite.

The private satellite now holds the sensitive data, along with the hash diff that allows Coalesce to detect changes over time.

Step 3: Creating the Non-Private Satellite (V0)

We repeat the process for the second satellite, this time focusing on non-sensitive attributes such as phone number, account balance, and comments.

Non-private satellite includes:

  • Hub hash key
  • Non-private hash diff
  • Phone
  • Account Balance
  • Comments
  • Load Date Timestamp
  • Record Source

Once configured and created, this satellite is also loaded and ready for historization.

Step 4: Creating V1 Satellites for Historization

V0 satellites store the raw history and all versions of descriptive data. To simplify querying, Coalesce supports generating a V1 Satellite, which is a view layered on top of the V0 Satellite.

The V1 Satellite adds:

  • Load End Date Timestamp (LEDT): identifies until when a record was valid
  • Is_Current Flag: marks the latest version of each record

These fields allow analysts to easily filter for the “current” state of descriptive attributes or build temporal reports when needed.

Creating a V1 Satellite is straightforward: right-click the V0 Satellite, add a node, and select the V1 Satellite template. Coalesce automatically generates all required SQL and fields.

After running the V1 satellites for both private and non-private data, you now have a complete Data Vault satellite layer: historized, query-friendly, and fully compliant with Data Vault 2.0 standards.

Why This Matters in Real Data Vault Implementations

This workflow demonstrates the core principles of Data Vault modeling:

  • Separation of concerns: Private data stays protected.
  • Change detection through hash diffs: Efficiently track what changed.
  • Historization: V1 satellites provide easy access to current and historical states.
  • Consistent metadata: Load timestamps and record sources support auditability.

Coalesce automates much of the repetitive work required in Data Vault, enabling teams to produce reliable, scalable models faster and with less manual SQL.

Final Thoughts

Creating Data Vault satellites in Coalesce.io becomes a smooth process once you understand the core concepts: preparing the stage, generating hash keys and hash diffs, organizing attributes into private and non-private structures, and finally adding V1 satellites for historization. With Coalesce’s Data Vault package, this modeling pattern becomes not only repeatable but highly efficient.

If you’re new to Data Vault or want to deepen your understanding of how its components work together, consider reviewing a Data Vault handbook or exploring more Coalesce transformation sessions. Each layer builds on the previous one, ultimately forming a flexible, auditable, and future-proof data warehouse architecture.

Watch the Video

What’s New in Data Vault 2.1 and Why It Matters for Modern Data Warehousing

What’s New in the Data Vault 2.1 Training

In the world of data warehousing and business intelligence, the Data Vault methodology has long been a trusted foundation for scalable and agile data architectures. With the release of Data Vault 2.1, the methodology has evolved to address new challenges in modern data environments — from handling semi-structured data to aligning with concepts like Data Mesh and Data Lakehouse.

CDVP2.0 and CDVP2.1 are separate courses, separate assessments, and separate professional certifications. The CDVP2.1 course materials were substantially revised and expanded, and the CDVP2.1 certification assessment questions were completely rewritten. A CDVP2.0 credential does not automatically confer CDVP2.1. To earn CDVP2.1, a professional must complete the separate CDVP2.1 course and certification.

In this article, we summarize what’s new in Data Vault 2.1 compared to 2.0, what these changes mean for practitioners, and how you can take advantage of the new training materials to become officially certified.


1. A Major Expansion in Content and Learning Resources

One of the most visible improvements in Data Vault 2.1 is the expansion of the official training content. The separate CDVP2.1 course and certification now includes extensive video material featuring Dan Linstedt himself, who explains and demonstrates key Data Vault principles in depth.

Participants can now spend several hours watching recorded theoretical sessions and hands-on demonstrations. The new format combines the benefits of self-paced learning with the engagement of instructor-led sessions. You can also download the official SQL loading patterns for all Data Vault entities from the Data Vault Alliance (DVA) training portal.

Another highlight is access to the Data Vault Alliance community — a global network of Data Vault practitioners where members exchange best practices, discuss implementations, and share insights from real-world projects.

2. Enhanced Instructor-Led Training Experience

The well-known three-day instructor-led training remains a cornerstone of the certification path, but it has been optimized to deliver even more value. Trainers now dedicate more time to practical case studies, group discussions, and collaborative modeling workshops.

Instead of spending large portions of class time on theory, participants focus on applying concepts to real-world data challenges. Trainers provide direct feedback on Data Vault models, encourage peer review, and help attendees explore different architectural scenarios.

This redesign creates a more interactive, productive learning experience — especially valuable for consultants, data architects, and engineers who want to strengthen their practical Data Vault expertise.

3. Better Preparation for Certification

Preparing for the official Certified Data Vault 2.1 Practitioner (CDVP2.1) exam is now easier and more structured. The course includes integrated live quizzes during training sessions, allowing participants to test their understanding and interact directly with the instructor.

In addition, a practice exam has been introduced to help you assess your readiness before attempting the final certification. This makes it easier to identify knowledge gaps and feel confident on exam day.

4. Dealing with JSON and Semi-Structured Data

One of the most exciting changes in Data Vault 2.1 is the new module on handling JSON data and other semi-structured sources. As modern data platforms increasingly deal with variable data structures, the methodology now provides clear guidance for integrating such data efficiently.

The course introduces a set of rules and best practices for balancing performance, flexibility, and complexity. You’ll learn when to apply a schema-on-read approach instead of schema-on-write, how to maintain stability as source structures evolve, and how to preserve governance and traceability in semi-structured environments.

Dan Linstedt often refers to this as the “JSON Dilemma” — the challenge of maximizing flexibility without sacrificing performance or clarity. Data Vault 2.1 equips you with the methodology and patterns to solve that dilemma effectively.

5. Stronger Differentiation Between Logical and Physical Modeling

Another core enhancement in Data Vault 2.1 is the clearer separation between logical and physical modeling. While Data Vault 2.0 touched on this concept, version 2.1 makes it explicit: the logical model represents the business concept, while the physical model depends on the underlying technology and performance needs.

For example, on some platforms normalization works best, while on others (such as document-oriented databases), denormalization might be more efficient. The physical implementation should adapt to these realities — but the logical model remains consistent as the blueprint for the business layer.

This separation provides greater flexibility to evolve with technology without compromising the integrity of the business model. It also helps teams align architecture decisions with specific database or cloud platform requirements.

6. Introducing Ontologies and Taxonomies

In line with the growing emphasis on semantic data integration, Data Vault 2.1 introduces the use of ontologies and taxonomies as essential tools for business modeling. These concepts allow organizations to connect business terms, hierarchies, and relationships in a way that supports consistent data integration across departments and systems.

By embedding ontologies and taxonomies into the modeling process, organizations can improve data understanding, reduce ambiguity, and strengthen the link between data structures and business meaning.

7. Extended Business Key Collision Code Concept

The Business Key Collision Code concept has been extended in Data Vault 2.1 to better support cross-system integration. This improvement helps resolve conflicts that arise when business keys overlap or differ across systems — a common challenge in enterprise data integration.

With enhanced rules and examples, the training now guides you through best practices for identifying, classifying, and merging business keys, ensuring a consistent, high-quality data foundation.

8. Merging Satellites Without PIT Tables

Data Vault 2.1 introduces new approaches for handling historical data when traditional Point-In-Time (PIT) tables or snapshot techniques are not required. In cases where you need to maintain very long data histories or join multiple satellites describing the same business object, version 2.1 outlines methods for merging satellites without relying on PIT tables.

This allows for greater flexibility in data retrieval strategies and helps optimize performance in long-term historical scenarios.

9. Alignment with Modern Industry Terminology

To stay relevant with the evolving data landscape, Data Vault 2.1 integrates current industry concepts such as Data Mesh, Data Fabric, and Data Lakehouse. These paradigms are mapped to the Data Vault framework, demonstrating how the methodology fits within modern data architectures.

This changes ensures that Data Vault practitioners can easily connect the methodology to the broader trends and technologies shaping the data industry today.

10. Unlock the Full Potential with Instructor-Led Training

If you’re ready to deepen your knowledge and apply these changes in practice, the instructor-led Data Vault 2.1 training offered by Scalefree is the next step. This hands-on training combines theoretical knowledge, real-world exercises, and guided discussions to help you implement Data Vault successfully in your organization.

Visit the training page to find more information, view upcoming training dates, and begin your journey toward CDVP2.1 certification.

Final Thoughts

Data Vault 2.1 represents a significant step forward for data professionals seeking a future-proof methodology. With improved training content, better integration of semi-structured data, a sharper focus on modeling concepts, and alignment with modern architectural trends, Data Vault continues to be a robust choice for building scalable, flexible, and business-aligned data warehouses.

Professionals who previously completed CDVP2.0 may choose to complete the separate CDVP2.1 course and certification, that provides the tools, knowledge, and community support to take your data architecture to the next level.

Watch the Video

Is the Data Warehouse Dead?

From Data Warehouse to Data Platform

Every few years, a new buzzword hits the data industry — and suddenly, the tools and methods we’ve relied on for decades are declared obsolete. Today, that target seems to be the data warehouse. Blogs and conferences proclaim its death, replaced by the data lake, data lakehouse, or even the elusive “data mesh.” But is the data warehouse really dead? Or has it simply evolved into something new?


The “Death” of the Data Warehouse: Where It All Began

For years, the data warehouse has been the foundation of enterprise analytics. It provided a structured, trusted, and governed environment where business data could be collected, cleansed, and analyzed. However, as data volumes exploded and new types of unstructured data emerged, traditional warehouses started showing their age.

Slow ETL processes, rigid schemas, and scalability issues led many to look for alternatives. Enter the data lake — a more flexible, schema-on-read environment that could store raw, unstructured data cheaply and at scale. Suddenly, the industry narrative shifted: data lakes were the future, and warehouses were history.

But as many organizations soon learned, simply dumping everything into a lake didn’t magically solve all their problems. Without governance, context, and structure, data lakes quickly turned into data swamps — massive pools of untrustworthy, undocumented information. And that’s when the story started to change again.

From Data Warehouse to Data Platform

From Warehouse vs. Lake to Warehouse + Lake

The debate shouldn’t be “data warehouse or data lake?” but rather “how do we combine them effectively?” Each serves a different purpose, and modern data platforms are proving that the most successful architectures leverage both.

The data lake is perfect for collecting raw, varied, and large-scale data — structured, semi-structured, or unstructured. It enables exploration, data science, and machine learning. But the data warehouse is still essential for delivering consistent, trusted, and audited data for business reporting and regulatory needs.

As one of our experts put it, the data lake can act as the source system for the data warehouse. The lake is where all data lands. The warehouse sits on top — a refined, curated layer where the most critical data is modeled, governed, and exposed to business users. Together, they form the backbone of a modern data platform.

Why the Data Warehouse Still Matters

Despite the hype around newer architectures, data warehouses provide several key benefits that data lakes alone can’t match:

  • Data Quality: Warehouses enforce rules and transformations that ensure accuracy and consistency across business domains.
  • Auditability and Compliance: Especially in industries governed by GDPR, HIPAA, or SOX, traceability is non-negotiable — something data warehouses excel at.
  • Performance and Optimization: Data warehouses are designed for analytical workloads and provide fast query performance on structured data.
  • Trust: Business users need reliable, validated data for decision-making. Data warehouses remain the single source of truth for that.

So no, the warehouse isn’t dead. It’s simply no longer alone.

Adapting to New Requirements: The Rise of Data Platforms

What has changed, however, is how organizations think about architecture. We’ve moved away from seeing data warehousing as a single monolithic system. Instead, the focus is now on building data platforms — unified ecosystems that combine the strengths of data lakes, data warehouses, and modern cloud technologies.

In this model, the data lake is used as an ingestion and exploration layer, capturing data from across the enterprise. The warehouse, meanwhile, becomes a downstream layer that provides refined, high-quality, and business-ready datasets.

This layered approach is often seen in Data Vault 2.0 architectures. The raw data is first stored in the lake (the “landing zone”), then structured into a raw vault for traceability, and finally transformed into a business vault for analytics and reporting. This methodology blends the flexibility of a lake with the governance of a warehouse — a best-of-both-worlds approach.

AI, Machine Learning, and the New Data Landscape

Another reason the “data warehouse is dead” narrative persists is the rise of AI and machine learning. These applications demand vast quantities of raw and semi-structured data — something traditional warehouses weren’t built to handle efficiently. However, this doesn’t mean warehouses are obsolete; it means they play a different role.

In AI-driven organizations, data scientists use the lake to experiment and train models. Once insights are validated, curated datasets are pushed into the warehouse to ensure they’re governed, standardized, and auditable. This workflow creates a feedback loop between the lake and the warehouse, ensuring agility without sacrificing control.

Modern data warehouses, especially cloud-native ones like Snowflake, Azure Synapse, and Google BigQuery, have also evolved. They now support semi-structured data, elastic scalability, and real-time processing — bridging the gap between lakes and traditional warehouses.

Lessons from the Field: It’s Not About Technology, It’s About Strategy

When companies struggle with data warehousing, it’s rarely because of the technology itself. More often, it’s about poor design, lack of governance, or outdated processes. As many experienced data engineers know, legacy warehouses often become complex, undocumented systems — “historically grown” solutions that no one fully understands.

The real issue isn’t whether to abandon the warehouse. It’s about how to modernize it. That means introducing automation, adopting agile data modeling techniques, and leveraging modern tools that eliminate manual maintenance work.

It also means changing the way organizations think about data. Instead of treating governance as a roadblock, teams should see it as a foundation for scalability. Instead of building massive, inflexible ETL pipelines, they should adopt modular data vault or ELT-based approaches that evolve as business needs change.

Practical Takeaways for Modern Data Teams

  • Stop chasing buzzwords. Data lakes, meshes, and fabrics are valuable, but none are silver bullets. Understand the business problem first.
  • Combine technologies strategically. Use data lakes for exploration and AI, data warehouses for governance and trust.
  • Modernize your warehouse, don’t replace it. Adopt cloud platforms and automation to remove legacy bottlenecks.
  • Think in terms of platforms. Build an integrated data ecosystem instead of disconnected tools.
  • Embrace continuous evolution. The future of data is hybrid, agile, and adaptive — not one-size-fits-all.

Conclusion: The Data Warehouse Is Evolving — Not Dead

The data warehouse isn’t a relic of the past. It’s a vital component of the modern data platform. What’s changing is the way we design, use, and integrate it. By combining the strengths of data lakes and warehouses, organizations can unlock the full potential of their data — balancing flexibility with governance, and innovation with reliability.

The future of data architecture isn’t about replacing one system with another. It’s about convergence. The warehouse, the lake, the lakehouse — all of them are part of a single, connected platform designed to empower both business users and data scientists. So no, the data warehouse isn’t dead. It’s alive, evolving, and more relevant than ever.

Watch the Video

How to Publish Power BI Reports with the dbt Semantic Layer

Publishing Power BI Reports with the dbt Semantic Layer

Welcome back to our two-part guide on connecting Power BI to the dbt Semantic Layer. In Part 1, we demonstrated how to connect Power BI Desktop to dbt Cloud and build a simple dashboard using semantic metrics. That was just the beginning.

In this article, we continue the journey by publishing that report to Power BI Service and configuring the On-premises Data Gateway to ensure the connection to the dbt Semantic Layer remains alive. This is a crucial step for moving from a personal development workflow to a shared, production-ready BI environment.


Why Power BI Service Needs a Gateway

When you publish a Power BI Desktop report connected to the dbt Semantic Layer, the connection details don’t automatically carry over to Power BI Service. Instead, you’ll likely see an error message such as “The model cannot be loaded”. This happens because:

  • Power BI Service cannot directly use the desktop connection credentials.
  • A secure, always-online connection is required to keep queries alive.

The solution is to use the On-premises Data Gateway. This component securely bridges Power BI Service with your data sources—whether on-premises or cloud-based—so your dashboards can refresh seamlessly.

Step 1: Publish the Report to Power BI Service

We’ll start where we left off in Part 1, with a working report in Power BI Desktop named DEMO – dbt Semantic Layer.

  1. Open the report in Power BI Desktop.
  2. Click the Publish button.
  3. Choose a workspace (for this demo, we’ll use “My workspace”).
  4. Open Power BI Service and locate the published report.

At this stage, you’ll notice that the report cannot load data. This is expected and is exactly why we need to configure the gateway.

Step 2: Install the On-Premises Data Gateway

To enable the connection, download and install the On-premises Data Gateway in Standard mode. The dbt Semantic Layer connector is not supported in Personal mode at this time.

Download link: Get the Power BI Gateway (Microsoft).

During installation:

  • Choose Standard mode.
  • Follow the guided steps and complete the setup.
  • Launch the gateway after installation.
  • Sign in with your Power BI Service account to register the gateway.

At this point, your gateway should show as online and ready to use.

Step 3: Configure Custom Connector Support

The dbt Semantic Layer connection is enabled through a custom Power BI connector. This requires a manual file copy:

  1. Locate the connector file on your machine. By default, it is stored in:
    C:\Users\<YourUsername>\Documents\Power BI Desktop\Custom Connectors\dbtSemanticLayer.pqx
  2. Copy this file into the gateway’s custom connector directory:
    C:\Windows\ServiceProfiles\PBIEgwService\Documents\Power BI Desktop\Custom Connectors
  3. Restart the gateway if needed. The connector should now be detected under the Connectors section of the gateway.

This step is critical—without copying the connector, the gateway will not recognize the dbt Semantic Layer.

Step 4: Configure the Gateway in Power BI Service

With the gateway online and the custom connector installed, it’s time to configure the connection inside Power BI Service:

  1. In Power BI Service, navigate to Settings → Manage Connections and Gateways.
  2. Select your gateway from the list of available gateways.
  3. Go to the gateway Settings and allow the use of Custom Connectors. Without this option, the connection will fail.
  4. Next, go to Settings → Power BI Settings → Semantic Models.
  5. Locate your published report (DEMO – dbt Semantic Layer).
  6. Under Gateway and Cloud Connections, add your connector to the gateway and provide the required host, environment ID, and service token values.

Once these steps are complete, your Power BI Service report should start loading live data from the dbt Semantic Layer.

Step 5: Validate the Connection

Open your report in Power BI Service. This time, instead of the “model cannot be loaded” error, you should see the data loading and the dashboard visuals appearing. This confirms that the gateway is successfully maintaining the connection to the dbt Semantic Layer.

Summary of the Workflow

Let’s recap what we’ve achieved across both parts of this series:

  1. Part 1: Connected Power BI Desktop to the dbt Semantic Layer and built a working dashboard using semantic metrics.
  2. Part 2: Published the report to Power BI Service, configured the On-premises Data Gateway in Standard mode, enabled custom connectors, and restored connectivity to the dbt Semantic Layer.

The end result? A Power BI dashboard that queries dbt metrics live, end-to-end, even in the Service environment.

Best Practices

While the demo used a local laptop, in production environments the On-premises Data Gateway should be installed on a reliable, always-on machine, such as:

  • An on-premises server.
  • A cloud-hosted virtual machine (e.g., Azure VM, Amazon EC2).

This ensures the connection remains stable, and report refreshes happen as scheduled without interruption.

Conclusion

Connecting Power BI Service to the dbt Semantic Layer is a powerful way to extend governed, consistent metrics to your entire organization. By configuring the On-premises Data Gateway and enabling custom connectors, you ensure that your published reports continue to deliver real-time insights based on dbt’s semantic definitions.

If this guide was helpful, make sure to check out Part 1 if you haven’t already, and stay tuned for more deep dives into the dbt platform and BI integrations.

Additional Resources

Watch the Video

Data Governance Made Simple with dbt Platform

Data Contract Data Pipeline

Why governance is important when working with data products

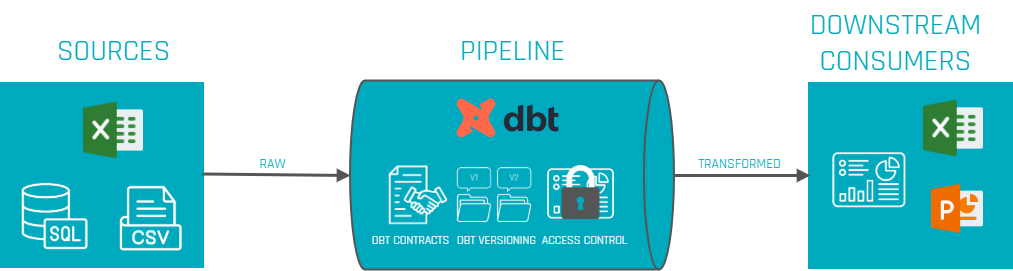
As data analytics grows within a company, it becomes more important to prevent changes in one part of the system from breaking things in another. This is important for reports and dashboards that depend on shared dbt models. To manage this growing complexity, dbt now offers key data governance features like

  • model contracts,
  • model versioning, and
  • access control.

These tools help ensure data remains consistent and reliable as projects scale. By using these features, data teams can work together more smoothly, avoid surprises from model changes, and improve overall data quality and trust across the business.

This article takes a closer look at what these features do, why they matter, and how they can support smoother collaboration and stronger data quality across the business.

Data Governance Made Simple with dbt Platform

Scaling your data projects shouldn’t mean sacrificing reliability. This session will tackle the critical issue of data governance in dbt, showing you how to stop data chaos and prevent upstream changes from breaking downstream models. You’ll learn to implement dbt features like Model Contracts, Versioning, and Access Control with a practical, hands-on demonstration. Register for our free webinar, December 4th, 2025!

Register Me Now
Data Contract Data Pipeline

Figure 1: Data contracts act as a safeguard across the entire data pipeline.

Imagine this scenario: A data team has a pipeline to load customer data into a warehouse, and the marketing team relies on it for campaigns. So the downstream consumer, in this case the marketing team, expects fields like customer_name, but an upstream change renames this field to customer_full_name. The marketing team tries to consume this break without anyone immediately noticing. The result? The query would fail since the renamed field is not known to the downstream team. Without a dbt contract, this kind of schema change slips through and causes these downstream failures. When contracts are implemented, however, such a change would trigger an alert or validation error in the pipeline, catching the discrepancy between expected and actual data and preventing the issue.

Data Contracts – Providing Schema Consistency

Data contracts in dbt are a way to ensure what a model is expected to produce. In other words: a contract defines the exact structure of the output table – including which columns are present, what types of data they are or other structural rules. It’s similar to how API contracts work in software: downstream users can count on a consistent format, and if something breaks that expectation, dbt throws an error or a warning during runtime instead of letting flawed data flow further downstream.

With a contract in place, teams can define:

  • Which columns must be present – and block unexpected extras or missing fields.
  • The type of data (e.g. strings, integers, timestamps).
  • Null rules or other constraints, like if a field is allowed to contain null values or can be unique.

These rules are defined in a separate YAML schema file (not directly in the SQL model). For example, a model called orders might have a contract that lists all required columns and their data types, ensuring that every time the model runs, the structure matches what’s been agreed:

models:
- name: orders
  config:
    contract:
      enforced: true
  columns:
    - name: order_id
      data_type: integer
      constraints:
        - type: not_null
    - name: customer_id
      data_type: integer
    - name: order_date
      data_type: date

Once the variable enforced: true (line 5) is set on a model, dbt will validate the output of the SQL before the model is built. It checks that the result includes exactly the expected columns, in the right data types – no extras, no missing fields, no mismatches. If something does not align, dbt throws an error or warning and stops the process before the issue can affect anything downstream. This gives teams a safety net against accidental changes to a model’s structure – whether that’s someone renaming a column, dropping it, or introducing a mismatch in data types.

From a business perspective, this adds a layer of reliability. Teams working with downstream dashboards, reports, or models can rely on a consistent structure without fear that a seemingly small upstream change will quietly break their work. Take the example of a renamed field in a customer model: with a contract in place, that kind of change would’ve been caught during development or CI (Continuous Integration) – before it ever reached production and disrupted reporting. Data contracts bring the discipline of software development (similar to API interface contracts) into analytics work, helping everyone stay aligned on how the data is structured. That is especially valuable in environments where many teams are working from shared models – a clear contract reduces confusion and avoids broken pipelines.

Tip

Not every model needs a contract. It’s good to start with critical, high-impact models (those feeding important dashboards or reports). Applying contracts does add some overhead and rigidity, so dbt’s guidance is to ensure your project is sufficiently mature and the model’s schema is relatively stable before enforcing a contract.

Model Versioning – Managing Change Gracefully

In the previous section it became clear that contracts are able to keep the model’s structure. Even with contracts in place, there are situations where besides the model’s structure, the logic needs to be changed. This could go beyond renaming/removing columns or changes in data types and more into e.g. changing the calculation of columns. On a small team, you could probably just make the change and tell everyone to update their queries. But in a larger organization, that kind of quick shift is risky – one change could break a lot of downstream applications like dashboards or other downstream models.

That’s where model versioning comes in (introduced in dbt v1.5+). Model versions bring structure to model evolution. Instead of forcing immediate changes, versioning allows multiple versions of a model to live side by side, giving teams time to transition.

Here’s how it works:

  1. Create a new version of the model: You start by creating a new version of the model – normally by just duplicating the file with a _v2 suffix – and make your changes there.
  2. In the model’s YAML config file, you declare all existing versions and mark which one is currently latest.
  3. Test the new version: During testing, both versions can be run in production. For testing purposes, consumers can point to a specific version explicitly.
  4. Promote the new version: Once the adjustments are done, the YAML can be updated to make it the latest one.
  5. Deprecate and remove the old version: Eventually, the old version is deprecated. You can even set a deprecation_date so it’s clear when it will be removed for good. But to be clear, the deprecation_date is just an indicator/piece of information during runtime, the model won’t be deactivated automatically after the date passes.

This approach helps teams migrate in a controlled way. Instead of breaking queries over night, there’s a shared window where both old and new versions exist. Teams have time to update at their own pace, and model authors don’t need to hold back on necessary improvements. It’s a clean parallel to versioned APIs – the idea being that a dbt model, once shared, is similiar to a public interface others rely on.

By treating models as versioned products, data teams avoid having broken queries and are able to regain control over how changes are introduced. It makes collaboration safer and more sustainable, especially when many teams depend on shared upstream models. Therefore, model versioning brings real change management to the day to day work with data.

Note: Model versioning is a concept meant for mature datasets that have multiple dependents. If your project is small or models change rapidly in early development, you might not need to formally version every change. At smaller scale, it’s often acceptable that downstream analyses update in lockstep with model changes. But as you “scale up” the number of models, consumers, or even adopt a data mesh approach with multiple projects, versioning becomes indispensable for stability.

Access Control – Modularizing and Securing Your Models

The third pillar of dbt governance is access control for models. In complex organizations, it’s possible that not every data model is meant to be used everywhere by everyone. Some models are intermediate or meant for a specific team, while others are data products meant for wider consumption. To define what data is accessible for who (ref() function), dbt now allows access levels for each model.

To enable this, dbt introduces the concept of groups and access modifiers:

  • Groups: Models can be organized into groups and assign each group an owner. Groups are essentially labels for a set of models that share a logical theme or ownership. This helps turn implicit relationships into explicit boundaries – leading to a clearer model ownership.
  • Access modifiers: Each model can be marked as private , protected , or public to indicate its accessibility to other models.
    • Private: only other models in the same group can reference it. It’s hidden from the rest of the project.
    • Protected: (default) any model within the same project can reference it, but models in other projects cannot. This is how models behaved historically in dbt – accessible project-wide but not exposed to the outside by default.
    • Public: any model, even in other projects (or installed packages), can reference it. This explicitly marks the model as part of a public interface for cross-project use.

By default, models are considered protected for backward compatibility. Using groups and access modifiers together, you can make certain models truly private to a specific team while safely sharing others as needed. For example, a finance team’s intermediate calculation model might be tagged private to finance, so only finance models can use it. If a marketing model tried to ref(‘finance_model’) that was private, dbt would throw an error during parsing, blocking the unauthorized dependency. Meanwhile, a carefully designed model of “Customers” might be marked public so that it can be referenced by models in any project across the company.

Why is this valuable?

It enforces modularity and ownership. Teams can develop models without fear that another team will depend on their internal logic. It prevents the problem, that anything can depend on anything, which becomes hard to manage. Instead, only well defined public models become the integration points between different groups or projects. This kind of access governance improves security (sensitive data can be kept in private models) and maintainability, since changes to a private model won’t ripple out beyond its group.

Governance vs. User Permissions: It’s important to differentiate between model access as described above and user-level permissions. The features that was discussed is about design-time and run-time control of model dependencies in dbt projects. In practice, this is used in conjunction with your data warehouse’s security (and dbt Cloud’s user roles) to ensure only the right people or tools can run or query these models. Model governance is about structuring the project for safe collaboration; it complements (but does not replace) standard data access controls.

Conclusion – Toward Reliable and Scalable Data Projects

In summary, dbt’s governance capabilities like contracts, versioning, and access control provide a framework for reliable, scalable data transformation workflows. They bring proven software engineering principles into the analytics engineering realm:

  • Data contracts ensure that upstream changes don’t unknowingly break downstream models/consumers by enforcing schemas and data integrity rules at build time.
  • Model versioning treats important datasets as stable interfaces, allowing teams to implement improvements without sudden disruptions – enabling change with graceful deprecation instead of chaos.
  • Access control (with groups and private/protected/public models) modularizes your project, so teams can work peacefully within their domain while providing clear interfaces and preventing unintended coupling between projects.

Adopting these practices means fewer hotfixes caused by broken pipelines. As one blog put it, when scaling up dbt or moving towards a multi-team data mesh, these governance features become non-negotiable – they let you treat your data models “like products: stable, predictable, and version-controlled”. In short, they help you scale with confidence.

Finally, it’s important that governance features should be introduced thoughtfully. It’s possible to overengineer too early – adding contracts or strict version control to models that are still rapidly evolving may slow the process down. The best approach is to apply these tools to the most critical and stable parts of your data model, and expand as the project needs grow.

Data Vault on dbt Snapshots

Data Vault on dbt Snapshots

In recent years, dbt has become one of the most popular tools in modern data stacks. At the same time, Data Vault continues to be a proven methodology for building scalable, auditable, and historically complete data warehouses.

It is therefore no surprise that questions arise at the intersection of both worlds. One question we recently received perfectly captures this:

“Can you build a Data Vault view downstream off of dbt snapshots?
I feel dbt snapshots are safer because they capture data ‘as is’, and a Data Vault might be designed wrong.”

This is a great question—and one that touches architecture, performance, data modeling, and risk management at the same time. In this article, we’ll unpack the topic step by step and give a clear, practical answer.


First Things First: What Are dbt Snapshots?

Before we compare dbt snapshots with Data Vault concepts, let’s align on what dbt snapshots actually are.

According to dbt’s own documentation, snapshots are used to implement Type 2 Slowly Changing Dimensions (SCD Type 2) on mutable source tables.

If you’re familiar with dimensional modeling, this should sound very familiar. SCD Type 2 means:

  • Whenever a record changes, a new row is inserted.
  • The old version of the record is kept for historical analysis.
  • Validity timestamps define from when to when a record version was valid.

In a typical example, a source table might only store the current state of an order:

  • January 1st: Order status = pending
  • January 2nd: Order status = shipped

The source system overwrites the status, so you only ever see the latest value. But in analytics and data warehousing, we usually want to know how the data looked at a specific point in time.

That’s where dbt snapshots come in. They store multiple versions of the same business key and enrich the data with technical columns such as:

  • dbt_valid_from
  • dbt_valid_to

Whenever dbt detects a change, it:

  • Inserts a new row for the new version.
  • Updates the dbt_valid_to of the previous version.

From a functional perspective, this is classic SCD Type 2 behavior.

dbt Snapshots vs. Data Vault Satellites

Now let’s compare dbt snapshots with Data Vault modeling. This is where things get interesting.

In Data Vault, Satellites are responsible for storing descriptive attributes and tracking changes over time. In other words:

  • Satellites are also SCD Type 2 structures.
  • They store full history.
  • They insert a new row for every detected change.

So at first glance, dbt snapshots and Data Vault satellites look almost identical. And conceptually, they are very close.

However, there is one important difference.

Insert-Only vs. Update-Based Modeling

Modern Data Vault implementations follow a strict insert-only approach. That means:

  • No updates to existing records.
  • No physical valid_to column updates.
  • History is reconstructed using window functions or Point-in-Time (PIT) tables.

dbt snapshots, on the other hand, do update the previous record to set the dbt_valid_to timestamp.

From a pure modeling perspective, both approaches are valid. But from a platform and performance perspective, insert-only has some strong advantages—
especially in cloud data warehouses like Snowflake, BigQuery, or Redshift.

Why Insert-Only Matters in the Cloud

Cloud-native data warehouses are optimized for append-heavy workloads.

For example:

  • Snowflake uses micro-partitions that are immutable.
  • Updates often result in copy-on-write operations.
  • Insert-only workloads scale better and are cheaper.

This is one of the reasons why Data Vault adopted insert-only patterns years ago. It’s not just about modeling philosophy—it’s about performance and scalability.

That doesn’t mean dbt snapshots are “wrong”. It just means they were designed with a slightly different use case in mind.

Where dbt Snapshots Shine

From a practical standpoint, dbt snapshots are extremely useful in specific scenarios.

One very common use case is a persistent staging area.

Imagine you receive:

  • Full data extracts every day from a source system.
  • No CDC (Change Data Capture).
  • Large tables where storing daily full loads would be wasteful.

In this case, dbt snapshots allow you to:

  • Store only the changes between loads.
  • Keep historical versions.
  • Reduce storage and processing overhead.

From this perspective, dbt snapshots act like a slim persistent staging layer. They capture the source data “as is” and preserve history.

If you already receive proper CDC data from upstream systems, then dbt snapshots are often unnecessary. The change tracking has already been done for you.

Back to the Core Question

So let’s return to the original question:

Can you build a Data Vault view downstream of dbt snapshots?

Technically and conceptually, the answer is:

Yes, you can.

If your dbt snapshots contain all source changes, you have everything you need to:

  • Identify business keys.
  • Track attribute changes.
  • Build hubs, links, and satellites.

In theory, you could build a fully virtualized Data Vault layer on top of snapshots:

  • Virtual hubs
  • Virtual links
  • Virtual satellites

From a data completeness perspective, nothing is missing.

The Real Challenge: Performance and Cost

Unfortunately, theory and reality often diverge.

While a fully virtualized Data Vault sounds elegant, it usually doesn’t work well in practice—at least not today.

Why?

  • Large historical datasets require heavy joins and window functions.
  • Virtualization pushes computation to query time.
  • Cloud compute costs increase rapidly.

In most real-world environments, fully virtualizing the Data Vault on top of snapshots leads to:

  • Slow queries
  • High compute bills
  • Poor user experience

That’s why most architectures still materialize the Data Vault at some point.

Does a “Wrong” Data Vault Design Mean Data Loss?

Another concern in the question is the fear of designing the Data Vault “wrong”.

This fear is understandable—but largely unfounded.

One of the core promises of Data Vault is:

You do not lose data due to modeling decisions.

Even if:

  • You split satellites too much.
  • You group attributes differently than you would today.
  • You later realize a better modeling pattern.

You can always:

  • Refactor satellites.
  • Split or merge them.
  • Reload data from existing Data Vault tables.

This is possible because Data Vault stores raw, historized data—not business logic.

So while a persistent staging area can be helpful, it is not a safety net you absolutely must have. A properly loaded Data Vault already is that safety net.

A Pragmatic Recommendation

So what does a pragmatic architecture look like today?

  • Use dbt snapshots if you need a persistent staging layer and don’t have CDC.
  • Materialize the Raw Data Vault for performance and scalability.
  • Virtualize downstream layers (Business Vault, Information Marts) where possible.

This approach balances:

  • Data safety
  • Performance
  • Cost efficiency

As data volumes grow and histories span years or decades, full virtualization simply becomes inefficient. Materialization at the Raw Vault level is still the sweet spot in most projects.

Final Thoughts

dbt snapshots are a powerful feature and fit nicely into modern data stacks. They can absolutely support Data Vault architectures—especially as a persistent staging layer.

However, they don’t eliminate the need for a materialized Data Vault. Nor do they replace the robustness and flexibility that Data Vault modeling provides.

Used together, dbt and Data Vault can form a strong, future-proof foundation for enterprise analytics—when each tool is applied where it makes the most sense.

Watch the Video

Simplify Data Pipelines with Custom Macros in Coalesce.io

Custom Macros in Coalesce.io

When working in data transformation platforms like Coalesce.io, efficiency and maintainability are everything. As your data pipelines grow, so does the complexity of your transformation logic. This is where custom macros become a powerful ally — they let you write reusable, dynamic SQL code that can be applied consistently across your entire data model.

In this article, we’ll explore how to use macros in Coalesce.io with the help of the Jinja templating language. You’ll see how a small example — converting currency values from cents to dollars — can scale into a reusable pattern that saves hours of development and maintenance time.


What Are Macros in Coalesce.io?

Macros are reusable pieces of logic that can be dynamically inserted into your SQL transformations. They’re written in Jinja, a templating language originally popularized in web development frameworks such as Django and Flask. Coalesce.io leverages Jinja to make SQL more dynamic and parameterized, letting you write logic once and reuse it anywhere.

In simple terms, a macro is like a small function that can generate SQL code on the fly. You define a macro once — for example, to perform a mathematical conversion, a date calculation, or a string manipulation — and then call it across multiple nodes in your Coalesce.io project.

Why Use Macros?

As data models evolve, repetitive transformations become a maintenance challenge. Imagine you have multiple columns across different tables that need to be converted from cents to dollars. You could copy and paste the same transformation logic everywhere, but what happens when the business decides to change the precision or switch the data type?

You’d have to update every single instance manually — a process that’s time-consuming and error-prone. With a macro, you simply change the logic once, and it updates everywhere it’s used. This drastically reduces maintenance efforts and improves consistency.

Setting Up the Example: Converting Cents to Dollars

Let’s walk through a simple example. Suppose you have a customer table with an account_balance column that stores values in cents. The business requires all monetary values to be in dollars for reporting and analytics. This means we need to divide the column by 100 and adjust the data type accordingly.

In Coalesce.io, we can perform this transformation directly within a stage node. You might start with something like:

{{ SC }} / 100::NUMERIC(18, 2)

The {{ SC }} syntax tells Coalesce.io to dynamically insert the source column name. After running the transformation, you’ll see that account_balance is now expressed in dollars instead of cents. So far, so good — but what if multiple columns or nodes need this conversion?

Copying and pasting this logic everywhere quickly becomes inefficient. This is the perfect case for turning the transformation into a macro.

Creating a Custom Macro in Coalesce.io

To define a new macro, navigate to your project’s Build Settings and locate the Macros section. There, you can create workspace-level macros that are available across your entire Coalesce.io environment.

Here’s a simple Jinja macro to convert cents to dollars:

{% macro cents_to_dollars(column, scale=2) %}
    ({{ column }} / 100)::NUMERIC(18, {{ scale }})
{% endmacro %}

This macro does a few important things:

  • Accepts parameters — The column parameter specifies which column to transform, and scale defines the number of decimal places (defaulting to 2).
  • Performs the conversion — It divides the value by 100 and casts it to a numeric type.
  • Is reusable — You can now call this macro anywhere without rewriting the logic.

Applying the Macro in a Transformation

Once your macro is defined, you can use it directly within your stage or transform node. For example, if you want to create a new column that stores the converted dollar value, simply write:

{{ cents_to_dollars('customer.account_balance') }}

This will execute the macro, substitute the SQL expression, and generate the proper transformation logic dynamically. You can even adjust the precision if needed:

{{ cents_to_dollars('customer.account_balance', scale=4) }}

With just one line of code, you’ve achieved a flexible, reusable transformation that can be applied across multiple nodes and columns.

Benefits of Using Macros in Coalesce.io

Macros may seem like a small feature, but their impact on data engineering workflows is significant. Here are a few key advantages:

1. Reduce Maintenance Overhead

When transformation logic changes, you only need to update it in one place. This ensures consistency across your pipelines and minimizes human error.

2. Promote Reusability

Macros make your codebase more modular. Teams can share standardized transformation logic, reducing duplication and ensuring best practices are applied everywhere.

3. Improve Readability

Instead of cluttering transformations with complex SQL expressions, you can reference clean, descriptive macro calls. This improves readability and helps onboard new team members faster.

4. Enhance Collaboration

Macros can be shared across teams or workspaces, enabling collaborative development in larger analytics engineering environments.

5. Simplify Complex Logic

As transformations get more sophisticated, you can encapsulate multi-step logic inside a macro. For example, handling data type conversions, conditional mappings, or even custom business rules — all within one reusable function.

Debugging and Testing Macros

Because macros generate SQL dynamically, debugging can sometimes feel tricky. Coalesce.io helps by allowing you to preview the compiled SQL code. After running a transformation that uses a macro, open the results to view the underlying SQL — you’ll see exactly how your macro was expanded and executed.

This visibility is crucial for validating logic and ensuring your macros behave as expected.

When to Use Macros

A good rule of thumb is simple:

If you find yourself repeating the same transformation in more than one place, consider turning it into a macro.

Macros are particularly useful for:

  • Currency or unit conversions
  • Data cleansing logic (e.g., trimming whitespace, normalizing case)
  • Timestamp or date formatting
  • Standard calculations (e.g., margin, growth rate, ratios)
  • Conditional logic applied across multiple datasets

By standardizing these repetitive transformations, your data environment becomes cleaner, easier to manage, and more scalable.

Best Practices for Writing Coalesce.io Macros

  • Keep macros simple — Each macro should serve a single clear purpose. Break complex logic into smaller, composable macros when possible.
  • Use default parameters wisely — Providing defaults (like scale=2) makes macros flexible and user-friendly.
  • Document your macros — Add comments explaining what each macro does and the parameters it expects. Future maintainers will thank you.
  • Test before scaling — Validate each macro on a small dataset before applying it widely.
  • Version control your macros — Store them in a shared Git repository or Coalesce.io workspace for collaboration and traceability.

Real-World Impact

In production environments, macros can save hours of repetitive work each week. Imagine applying the same data type conversion or formatting rule across dozens of tables — a single macro call replaces all those redundant SQL snippets.

Macros also make large-scale refactoring much safer. If a business requirement changes (for example, moving from numeric to money data types), one macro edit automatically updates every transformation that depends on it.

Final Thoughts

Custom macros in Coalesce.io aren’t just a convenience — they’re a foundation for scalable, maintainable data engineering. By abstracting common logic into reusable templates, you streamline your transformations, reduce technical debt, and empower your team to focus on building insights rather than maintaining code.

As a best practice, always look for opportunities to generalize repetitive logic. When you spot patterns across transformations, that’s your cue to create a macro. Start small, experiment, and watch your data pipelines become cleaner, faster, and easier to manage.

Next Steps

Explore Coalesce’s documentation on macros and Jinja templating to deepen your understanding. You can also download our free Data World Handbook — a comprehensive guide to modern data architecture, data vault modeling, and transformation best practices.

And if you’ve built interesting macros of your own, share them in the comments below. We’d love to see how you’re simplifying your Coalesce.io workflows.

Watch the Video

Row- & Column-Level Security in the Reporting Layer

Row-Level Security & Column-Level Security

In modern BI and Big Data architectures, security is no longer something you “add later”. If you build a data warehouse, a Data Vault, or even a smaller reporting solution without a clear security concept, you will almost certainly run into problems down the road.

One of the most common and most important questions we get in BI projects is: How do you actually implement row-level and column-level security in the reporting layer?

In this article, we’ll walk through the reasoning behind row- and column-level security, explain why hard-coded rules don’t scale, and show a proven, practical approach using access control lists (ACLs) directly in the data warehouse reporting layer.


Why Row- and Column-Level Security Matters

Let’s start with the basics. Why do we even need row-level and column-level security in a data warehouse or reporting layer?

The answer is simple: not all users should see all data.

Here are two very common examples from real-world projects:

  • Row-level security: A sales representative in Germany should only see customers from Germany (or the DACH region) and not customers from France, Spain, or other regions.
  • Column-level (attribute-level) security: Sensitive fields like revenue, margin, salary, or bonus information should only be visible to specific roles, such as finance or management.

These requirements exist in almost every company, regardless of size or industry. Yet, many teams still struggle to implement them in a clean, scalable way.

The Problem with Hard-Coded Security Rules

A common first approach is to implement security rules directly in reporting tools like Power BI, Tableau, or Looker. While this might work for a small number of reports, it quickly becomes a nightmare as your BI landscape grows.

Here’s why hard-coded security does not scale:

  • High maintenance effort: Every report or dashboard needs to be updated whenever security rules change.
  • Inconsistent logic: Different reports may implement slightly different rules, leading to confusion and errors.
  • Frequent changes: Users change departments, teams get reorganized, and access rules evolve over time.
  • Risk of mistakes: Forgetting to apply a rule in one report can expose sensitive data.

In short: implementing row- and column-level security repeatedly in every reporting tool is inefficient and risky.

The Core Idea: Access Control Lists (ACLs)

A scalable and proven approach is to use Access Control Lists (ACLs). This is a well-known concept in IT security and works extremely well in data warehousing and BI environments.

The idea is straightforward:

  • Maintain centralized tables (or files) that define who is allowed to see what.
  • Map users or user groups to business attributes, such as regions, countries, or access rights.
  • Apply these rules once in the reporting layer of the data warehouse.

Instead of implementing security in every report, you implement it in the data warehouse views that your reporting tools consume.

Users vs. User Groups: Always Think in Groups

One very important design decision: always work with user groups, not individual users.

Managing security on a per-user basis creates a lot of overhead and quickly becomes unmanageable. Groups, on the other hand, scale well and align nicely with how companies organize access rights.

A typical setup might look like this:

  • corp\\bi-read-DACH
  • corp\\bi-read-EMEA
  • corp\\bi-read-FINANCE

These groups are usually managed in Active Directory, Azure AD, or a similar identity provider. Your data warehouse then simply needs to know which group a user belongs to.

Implementing Row-Level Security with ACLs

Row-level security controls which rows a user is allowed to see. The ACL table for this typically maps user groups to business attributes.

A simplified example of a row-level ACL table could look like this:

USER_GROUP          | REGION_CODe --------------------|-------------
bi-read-DACH        | DACh bi-read-EMEA        | EMEa

This table says:

  • Users in the DACH group can see data for the DACH region.
  • Users in the EMEA group can see data for the EMEA region.

Where does this table live? Ideally:

  • In a master data system, if your organization has one.
  • In a reference data schema in the data warehouse.
  • For smaller setups, even an Excel file that is ingested regularly can work.

Applying Row-Level Security in Views

Once the ACL exists, applying it in the reporting layer is straightforward. In your Information Mart or reporting views, you simply filter based on the current user’s group.

Most modern databases allow you to access session context information, such as:

  • The current user
  • The current role
  • The current group

Conceptually, the SQL logic looks like this:

SELECT *
FROM customer c WHERE c.region_code IN (
    SELECT region_code     FROM row_level_acl     WHERE user_group = CURRENT_USER_GROUP()
)

The exact syntax depends on your database, but the concept is universal. The result: users only ever see rows they are allowed to see, no matter which reporting tool they use.

Implementing Column-Level (Attribute-Level) Security

Column-level security works slightly differently. Instead of filtering rows, you control whether a column is visible or not.

Typical use cases include:

  • Revenue
  • Margin
  • Salary
  • Bonus

Again, the foundation is an ACL table. A simplified example:

USER_GROUP          | COLUMN_NAME | CAN_REAd --------------------|-------------|---------
bi-read-DACH        | revenue     | false bi-read-EMEA        | revenue     | true

In this example:

  • The DACH sales team cannot see the revenue column.
  • The EMEA finance team can see the revenue column.

Applying Column-Level Security in Views

In the reporting view, you typically implement column-level security using a CASE WHEN statement:

CASe     WHEN EXISTS (
        SELECT 1
        FROM column_level_acl         WHERE user_group = CURRENT_USER_GROUP()
          AND column_name = 'revenue'
          AND can_read = true     )
    THEN revenue     ELSE NULl END AS revenue

If the user is allowed to see the column, they get the value. If not, they get NULL. From the reporting tool’s perspective, the column exists but contains no sensitive data.

Who Should Manage the Security Rules?

One important organizational point: the data warehouse team should not manually manage ACLs.

Security rules change frequently, and they are usually driven by business or governance decisions. Ideally:

  • Reporting or data governance teams own the rules.
  • Business users can maintain ACLs via a master data system or controlled interface.
  • The data warehouse simply consumes these rules.

This separation of responsibilities reduces operational overhead and avoids constant change requests to the IT or data engineering team.

Automation Is Key

In modern data stacks, manual SQL coding should be the exception, not the rule. Security logic is no different.

If you write row- and column-level security logic manually for every single view, you will:

  • Forget to apply it in some places.
  • Introduce inconsistencies.
  • Create unnecessary technical debt.

The better approach is to standardize and automate.

For example:

  • Use dbt macros to apply security logic consistently.
  • Enable or disable security with a simple configuration flag.
  • Automatically apply security to all views in a specific schema.

In one project, we implemented a dbt security macro that could be activated with a single line of code. Depending on the configuration, the macro automatically injected the row- and column-level ACL logic into the view.

This ensures:

  • Consistency across the entire reporting layer.
  • Minimal manual effort.
  • Much lower risk of security gaps.

Where Should Security Be Applied?

Best practice is to apply row- and column-level security in the final reporting layer
of your data warehouse:

  • Information Marts
  • Presentation Layer
  • Semantic Layer

This keeps your raw and integration layers clean and flexible while ensuring that everything exposed to BI tools is properly secured.

Key Takeaways

  • Row- and column-level security is a foundational requirement in BI projects.
  • Hard-coded security in reports does not scale.
  • Access Control Lists provide a clean, centralized solution.
  • Always work with user groups, not individual users.
  • Apply security in the reporting layer of the data warehouse.
  • Automate everything using modern data tooling.

If you get these basics right early in your data warehouse or Data Vault project, you will save yourself a lot of pain, rework, and risk later on.

Watch the Video

How to Refactor Your Raw Data Vault: Proven Strategies for Scalable Multi-Tenant Data Warehouses

Refactoring the Raw Data Vault

Refactoring is a natural part of any evolving data architecture. Whether you’re adding a new entity, integrating additional source systems, or moving toward a multi-tenant Data Warehouse, change is inevitable. In this article, we’ll explore what it means to refactor your Raw Data Vault (RDV), why it’s essential, and how to do it safely using strategies like Hub-it-out.

The discussion is based on a real-world scenario where a company’s recruitment data model needed to evolve. Initially, the model tracked requisitions but didn’t fully capture recruiter details. With new requirements, the team needed to refactor their RDV to introduce a new Hub Recruiter entity — without breaking historical data or existing queries.


What Refactoring Really Means

Before diving into the technical details, let’s clarify what refactoring is — and what it isn’t.

Refactoring means changing the internal structure of your data model without altering its external behavior. Think of it as improving or extending the foundation — adding new components, reorganizing relationships, or optimizing loading logic — while keeping the overall functionality intact.

Redesign, on the other hand, means making user-visible changes. This might involve restructuring dashboards, altering reports, or redefining business logic in ways that affect your end users.

Since the Raw Data Vault is an internal structure (not typically user-facing), most adjustments here fall under refactoring. These changes are iterative and low-risk if your base model is valid.

Deploy First, Refactor Later

Many data teams fall into the trap of seeking the “perfect” model before deployment. But as experts at Scalefree emphasize — perfection is the enemy of progress. Instead of spending months debating the right business key or model structure, deploy a valid model quickly, gather feedback, and improve it through incremental refactoring.

“Don’t aim for the best model on day one. Aim for a valid model that you can continuously improve.”

This agile mindset ensures your team delivers value early and often. Over time, with each sprint, you evolve closer to the “best” model for your organization — even though, in truth, a perfect model doesn’t exist.

The Recruiter Example: When Business Requirements Change

Let’s revisit our use case: your company is in the recruiting business. Each job requisition is led by a single recruiter. Your original model included a RecruiterID in the requisition table but didn’t have a dedicated Hub Recruiter. Now, the business wants to integrate additional recruiter data from new source systems.

So how should you adapt your Data Vault model?

  • Do you close the old Link and create a new one that includes the Recruiter Hub?
  • Do you split existing Links into smaller, recruiter-focused relationships?
  • How do you handle historical backfills and multi-tenant variations?

The answer: you refactor using the Hub-it-out strategy.

Understanding the “Hub-it-Out” Strategy

“Hub-it-out” is a practical approach to introducing new Hubs and Links into your existing Raw Data Vault without reloading everything from the source systems.

Here’s how it works:

  1. Identify the business key in your existing Satellite. For example, you already have RecruiterID stored as an attribute, even if it wasn’t modeled as a Hub initially.
  2. Create a new Hub (Hub Recruiter) by selecting all distinct recruiter IDs from your existing Satellite data.
  3. Generate hash keys for each business key value and assign load dates and record sources from the Satellite’s first occurrence.
  4. Create a Link between the existing parent Hub (e.g., Requisition) and the new Hub (Recruiter) based on relationships already present in the Satellite.

With this approach, you can build new structures directly from your existing Data Vault — no need to reload historical data from source systems, which may not even be available anymore. If you have a data lake or Persistent Staging Area (PSA), you can also load from there as an alternative.

Why a Valid Model Is Everything

One key prerequisite for refactoring success is having a valid Raw Data Vault model. A “valid” model means that:

  • Data is captured consistently and completely.
  • No business keys or relationships have been lost during earlier transformations.
  • Hubs, Links, and Satellites follow proper Data Vault design rules.

If your model is valid, you can refactor it safely — adding Hubs, Links, or Satellites — without touching your original data sources. This makes evolution faster, cheaper, and much less disruptive.

Multi-Tenant Data Vault Considerations

When dealing with multiple clients or tenants, you should introduce a TenantID attribute in every Hub, Link, and Satellite. This ensures that data from one tenant never overwrites another’s records, since the hash keys will differ.

Typically, the first few tenants may require adjustments as you generalize your model. But after integrating the second or third tenant, the structure stabilizes. Each new tenant may add Satellites or minor extensions — but the overall architecture remains consistent.

Avoid Overloading Links

Each source system should define its own Unit of Work — a consistent relationship between business keys. If one system defines a Link between three business keys (e.g., Requisition, Candidate, Recruiter) and another defines it between two, treat them as separate Links. Avoid “overloading” Links by mixing different granularities or structures. That’s a common source of data inconsistency and confusion.

Transitioning Without Breaking Queries

Refactoring can be disruptive for power users who query the Raw Data Vault directly. Their queries may break when Hubs or Links are renamed, split, or replaced. To manage this transition smoothly:

  • Load both old and new entities temporarily. Keep the old Link active for a while, even if it’s limited to a single tenant.
  • Mark deprecated objects clearly. Add a “deprecated” flag or comment in your metadata catalog.
  • Communicate proactively. Notify users via email or release notes, giving them 90–180 days to adjust queries.

Despite communication efforts, some users will inevitably miss the deadline — but maintaining transparency and clear documentation helps minimize friction.

Using Virtual Views for Legacy Support

Instead of maintaining redundant tables, you can recreate deprecated entities as virtual views on top of your new Data Vault structures. This approach saves storage while still supporting legacy queries.

Yes, there’s a small performance trade-off, but since these views are temporary and clearly marked as deprecated, it’s an effective bridge strategy. Inform users that performance may decrease slightly and that these views will be removed after a defined period (e.g., one year).

When and How to Clean Up

Every new entity adds maintenance overhead — documentation, metadata management, refactoring complexity. Once your transition period ends, remove deprecated tables and views to keep your model clean and manageable.

Set a clear timeline with your business stakeholders, archive necessary backups, and drop the obsolete entities once the window closes. This keeps your RDV lean and reduces technical debt.

Key Takeaways

  • Deploy early — perfection isn’t required for value.
  • Refactor continuously through small, validated improvements.
  • Use the Hub-it-out strategy to extend your model safely.
  • Always maintain a valid Data Vault foundation to enable future flexibility.
  • Manage user expectations through clear communication and deprecation policies.

Final Thoughts

Refactoring your Raw Data Vault isn’t about redoing work — it’s about evolving intelligently. With the right strategies and mindset, you can adapt to new business requirements, integrate additional tenants, and maintain consistency without painful re-engineering.

Whether you’re adding a Recruiter Hub, optimizing Link structures, or modernizing your multi-tenant DWH, remember: the goal isn’t perfection. It’s progress — sprint by sprint, improvement by improvement.

Watch the Video

Data Governance in Agile Teams: Balancing Speed and Compliance

Agile Teams and Data Governance

In today’s fast-paced world of analytics and data-driven decision-making, organizations face a growing challenge: how to stay agile while maintaining strong data governance. For many teams, governance is seen as a roadblock — something that slows delivery, adds layers of bureaucracy, and drains motivation. But when implemented correctly, data governance doesn’t have to be a pitstop. It can actually be the engine that keeps your Formula One data team running at top speed — safely, reliably, and compliantly.


When Governance Feels Like a Pitstop

Many data professionals can relate to the frustration: you’re in the middle of a sprint, the team is shipping fast, and suddenly you have to stop everything for governance discussions. Documentation, approvals, compliance checks — they all take time. It can feel like racing a Formula One car and being forced to pull over every 100 meters.

This tension between agility and governance is common. Data engineers want to deliver quickly, while governance teams need to ensure trust, traceability, and compliance. When these two groups work in isolation, frustration grows on both sides. The result? Slower delivery, lower morale, and data that stakeholders don’t fully trust.

Formula One agile team working with data governance

Why Governance Still Matters — A Lot

Despite the frustration, data governance remains essential. With increasing regulations like GDPR and growing concerns over data privacy, security, and lineage, organizations can’t afford to ignore governance. Without it, data quickly loses reliability and can even expose the company to legal and reputational risks.

Governance provides the foundation for trustworthy data. It defines who owns the data, how it’s used, and how quality is maintained. The challenge is not whether governance should exist — it’s how it should be implemented in a way that supports agility rather than stifles it.

Breaking the “Slow vs. Fast” Mindset

One of the biggest misconceptions is that teams have to choose between being fast and being compliant. In reality, good governance can actually increase speed — if done the right way. Instead of launching massive governance projects that take months before showing value, organizations should start small.

Start with one use case. Define what data needs to be governed, what rules are necessary, and which processes can be automated. By building governance iteratively, teams can maintain momentum while gradually increasing compliance coverage. This approach mirrors agile methodology itself: small increments, continuous improvement, and fast feedback loops.

From Data Lake to Data Swamp

When governance is ignored, data platforms can quickly degrade. Data lakes, for example, often become “data swamps” — unstructured, inconsistent, and untrustworthy. Without clear ownership and metadata management, it becomes impossible to understand what’s inside, how it was sourced, or if it’s even accurate.

To prevent this, governance teams and data engineers must work together early in the project lifecycle. Metadata, lineage, and data quality checks should not be afterthoughts. By integrating these elements from the start, teams can ensure that the lake remains organized and that all data remains discoverable and auditable.

Collaboration Over Confrontation

Too often, governance and delivery teams operate like opposing forces — “the ones who slow us down” versus “the ones who don’t care about compliance.” This mindset kills productivity. The truth is, both sides share the same goal: reliable, high-quality data that supports business success.

To make governance work in agile environments, it must be treated as a team sport. Data engineers, analysts, and governance professionals should collaborate from day one, not after development is complete. Early involvement prevents costly rework and reduces the perception that governance is an obstacle.

Start Small, Then Scale

Big-bang governance projects often fail. Buying an enterprise tool and trying to document everything at once is a recipe for analysis paralysis. Instead, start with a single use case or dataset. Identify what metadata, access rules, and lineage details are truly necessary. Use that as a pilot to refine your process and showcase quick wins.

Once the first success is achieved, expand governance incrementally. This approach ensures that governance evolves naturally with the organization’s needs, rather than becoming an oversized initiative that never delivers value.

Practical Tips for Agile Data Governance

  • Integrate governance early: Bring governance experts into sprint planning and design discussions, not after development is complete.
  • Automate wherever possible: Modern tools offer built-in data lineage, metadata tracking, and policy enforcement — leverage them.
  • Adopt data vault architecture: Separate raw data (raw vault) from business logic (business vault) to ensure traceability and compliance.
  • Iterate and adapt: Governance rules should evolve just like software requirements. Continuously refine based on feedback.
  • Show value quickly: Demonstrate how governance improves quality, consistency, and trust — not just compliance.

Tools and Automation: Governance Without Overhead

Today’s data platforms — especially in Azure and other cloud ecosystems — offer native tools that make governance easier. Many ETL and metadata management platforms now include features such as:

  • Automated data lineage tracking
  • Built-in documentation and metadata management
  • Testing and validation frameworks
  • Policy enforcement and access control

Before investing in an expensive governance suite, review what’s already available in your existing stack. Often, these native features are more than enough to get started and can help you build the foundation for a more mature governance model later on.

Data Vault: A Governance Enabler

The Data Vault methodology is particularly effective for combining agility with governance. By separating raw and business layers, it provides full traceability of every transformation while supporting iterative development. Each change can be tracked and audited, ensuring compliance without slowing delivery.

This structure also supports GDPR and other data privacy requirements by isolating personally identifiable information and simplifying data lineage tracking. When implemented correctly, the Data Vault becomes a backbone for both agility and compliance.

Conclusion: Governance as a Team Sport

Data governance doesn’t have to be a roadblock for agile teams. When done right, it ensures trust, transparency, and collaboration across all stakeholders. The key is to stop viewing governance as something external to the data process. It’s an integral part of creating reliable, sustainable, and compliant data ecosystems.

Think of your data team as a Formula One crew. The engineers build speed. The governance team ensures safety and reliability. Only by working together can the car reach its full potential — fast, secure, and built to last.

Start small, collaborate early, and leverage automation. Over time, governance will shift from a burden to a strategic advantage — one that drives your organization forward with confidence.

Watch the Video

How to Connect to the dbt Semantic Layer Through Power BI

Connecting Power BI to the dbt Semantic Layer

As organizations increasingly rely on data-driven decision making, the ability to connect business intelligence tools directly to semantic layers becomes essential. One of the most common requests we’ve heard from our community is: “How can I connect Power BI to the dbt Semantic Layer to expose metrics?”

In this guide, we’ll walk through the entire process of setting up and connecting Power BI with the dbt Semantic Layer. By the end, you’ll be able to query dbt metrics directly in Power BI and build interactive dashboards that stay in sync with your semantic models.


Why Connect Power BI with the dbt Semantic Layer?

The dbt Semantic Layer allows teams to define business metrics and dimensions in one central place. Instead of duplicating logic across BI tools, analysts and business users can rely on consistent definitions for KPIs such as revenue, churn, or order count. When Power BI is connected to this layer, dashboards automatically reflect the same trusted metrics already defined in dbt.

This integration helps:

  • Maintain consistency in metric definitions across the organization.
  • Reduce manual work for analysts when creating Power BI reports.
  • Ensure real-time access to governed data models.

Pre-Requisites

Before starting, make sure you have the following:

  • A working dbt Cloud project with a configured Semantic Layer.
  • Permission to create or access a Service Token in dbt Cloud.
  • Installed version of Power BI Desktop.
  • Internet access to download the dbt Semantic Layer Power BI connector.

Step 1: Review the dbt Semantic Layer Setup

If you’re not familiar with how the dbt Semantic Layer is configured, check out Hernan Revale’s detailed session on setting up metrics and dimensions in dbt Cloud:
Watch the dbt Semantic Layer session here.

Step 2: Collect Required Credentials in dbt Cloud

Navigate to your dbt Cloud Dashboard and head to:

  • Settings → Semantic Layer or Settings → Edit Semantic Layer

Here, confirm or configure the following:

  1. Credentials for the deployment environment where your semantic models run.
  2. A Service Token linked to the Semantic Layer. If you don’t have permission, ask your dbt admin to create one.
  3. Your Environment ID and Host, which will be used in Power BI during connection setup.

Important: Store your Service Token securely. You’ll need it to authenticate Power BI.

Step 3: Install the dbt Semantic Layer Power BI Connector

Download the Power BI connector for dbt Semantic Layer from the official documentation:
Download the connector here.

Run the installer and follow the on-screen steps. After installation, verify it by checking the list of available drivers in the ODBC Data Sources. The dbt Semantic Layer connector should now appear in the list.

Step 4: Connect Power BI to the dbt Semantic Layer

Now that everything is set up, it’s time to establish the connection:

  1. Open Power BI Desktop and start a blank report.
  2. Search for dbt Semantic Layer in the available connectors.
  3. Accept the beta notice (as the connector is still under development).
  4. Provide the required details:
    • Host
    • Environment ID
    • Service Token
  5. Choose DirectQuery (Import is not yet supported).
  6. Click Load to access your metrics.

Step 5: Build a Simple Dashboard

Once the semantic model is loaded, you’ll see your dbt metrics in the Power BI fields pane. You can now build visualizations just like you would with any other dataset. For example:

  • Create a stacked column chart with “Orders Total” on the Y-axis and “Customer Region” on the X-axis.
  • Add slicers for Region, Market, or Segment to filter the data dynamically.
  • Include a card visualization to highlight key metrics such as total revenue.

At this point, your Power BI dashboard is fully connected to the dbt Semantic Layer. Metrics are updated live and reflect the definitions you’ve configured in dbt Cloud.

Step 6: What’s Next?

In this tutorial, we focused on connecting Power BI Desktop to the dbt Semantic Layer. In the next part of this series, we’ll publish the report to Power BI Service and explain how to retain dbt connectivity in a collaborative environment.

Stay tuned for the next video and article, and don’t forget to subscribe to our channel for updates.

Conclusion

Connecting Power BI to the dbt Semantic Layer is a powerful way to bring consistent, governed metrics directly into your BI environment. With a few configuration steps, you can ensure that every report and dashboard your team creates in Power BI leverages the same trusted metric definitions managed in dbt.

This setup not only accelerates dashboard creation but also strengthens data governance across your organization. As the connector continues to evolve, we can expect even smoother integrations and more functionality in the near future.

Additional Resources

Watch the Video

Close Menu