Data Vault 2.0 with dbt
In the first part of this blog series we introduced you to dbt. Now let’s take a look at how you can implement Data Vault 2.0 with dbt and what advantages this offers. If you don’t know the first part yet, you can read it here.
In this article:
Dbt Models
dbt provides the ability to create models and generate and execute SQL dynamically out of these models. This allows you to write your data transformations in models using SQL and reusable macros powered by Jinja2 to run your data pipelines in a clean and efficient way. However, the most important part for the Data Vault use case is the ability to define and use those macros.
But first we should clarify how models work in dbt.
This tool handles the compilation and execution of models written using SQL and the Jinja macro language. Each model consists of exactly one SQL SELECT statement. Jinja code is translated into SQL during compilation.
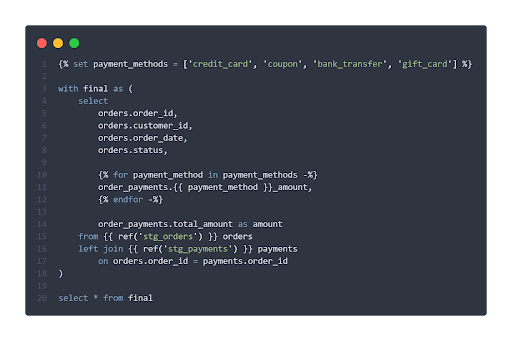
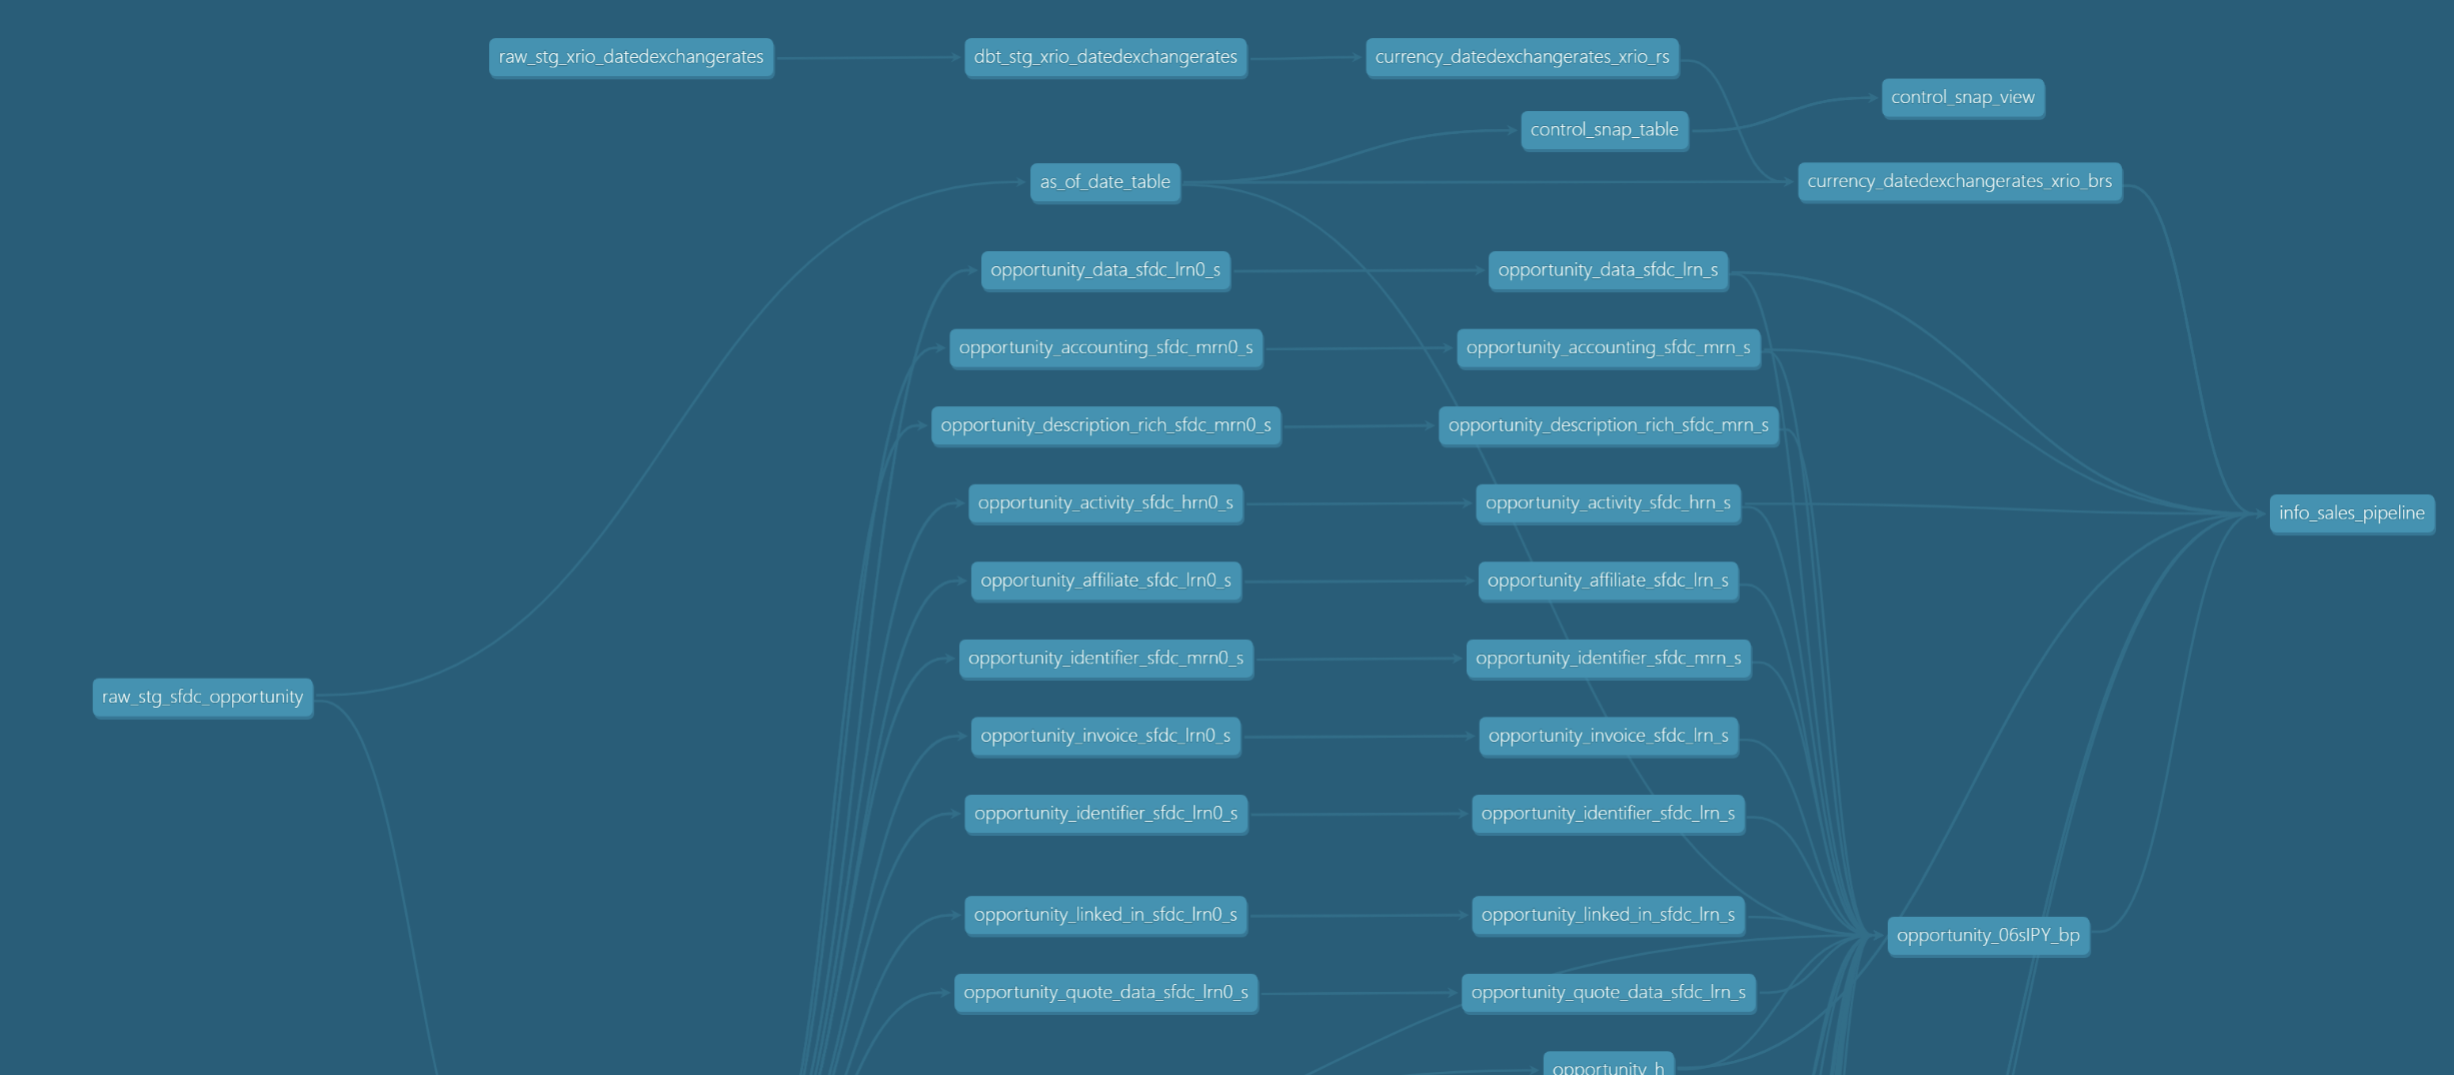
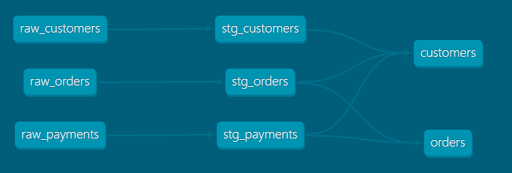
This figure shows a simple model in dbt. A big advantage of Jinja is the possibility to generate sql programmatically, for example with loops and conditions. Also, through the ref() functions, dbt understands the relationships between the models and builds a dependency graph. This ensures that the models are built in the correct order and that the data lineage is documented. A lineage graph may look like this:
The materialization of models can be defined at different configuration levels. This allows fast prototyping with views and switching to materialized tables if necessary for performance reasons.
Data Vault 2.0 and Macros
But how can we implement Data Vault 2.0 with dbt? The most important part for using Data Vault 2.0 is the ability to define and use macros. Macros can be called in models and then generate into that macro additional SQL or even the entire SQL code.
For example, you could create a macro to generate a hub that gets the source/staging model as an input parameter, as well as the specification of the columns for the business key(s), load date and record source. The sql code for the hub is then generated dynamically from this. The advantage of this is that a change to the macro would directly affect each individual hub, which greatly improves maintainability.
At this point, you also gain huge benefits from the active open-source community around dbt. There are many open-source packages with which it can be extended.
There are also already some packages that are perfect for using Data Vault 2.0 with dbt.
For example, our own open-source package DataVault4dbt, developed and actively maintained here at Scalefree, provides a comprehensive set of dbt macros to translate a Data Vault model “on paper” into actual tables and views—such as Hubs, Links, Satellites, and more. The package is actively used in real-world projects and helps enforce best practices for a modern, audit-friendly Data Vault 2.0 implementation.
To explore all features and macro parameters in detail, check out the documentation.
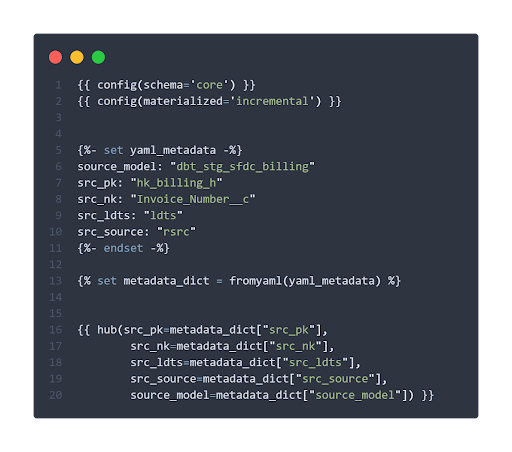
The only thing you need in your model, for example for a hub, is just one macro call:
{%-

hub(src_pk, src_nk, src_ldts, src_source, source_model)

-%}
With the parameters of the macro call you define the source table where the columns can be found (source_model) and the column names for the hash-key (src_pk), business key(s) (src_nk), load date (src_ldts) and the record source (src_source) column. When the model and the macro(s) defined in the model are executed, the SQL gets compiled and processed on the database system.
The metadata needed can for example be defined in variables with jinja directly in the model:
What you can also see is that this tool provides different options for the materialization. The incremental materialization for example, will load an entity as a table on an incremental basis.
When the model is executed, dbt generates the whole sql out of the macro and decides how the records are loaded. If the hub table does not exist, yet it is created and all records are loaded, if it already exists, the table is loaded incrementally.
For people who tried or managed to implement a Data Vault with “vanilla” SQL, you will realise that this is a real game-changer. The team can now focus entirely on the Data Vault design itself. Once the metadata is identified, dbt, along with your macros, can take care of the entire logic.
Openly available packages can add basic Data Vault 2.0 principles to dbt and therefore allow users to quick-dive into Data Vault implementation. Dbt’s general openness allows you to adjust all macros, for example, to your company or project specific Data Vault flavor to meet your technical and business requirements.
It is important to note that many of the currently available dbt packages for implementing Data Vault 2.0 deviate from the official standards in some details. Our own open-source package DataVault4dbt, developed and actively maintained here at Scalefree, addresses this gap by supporting all core Data Vault 2.0 entities and the latest best practices. The package is already used in real-world projects to help ensure a modern and audit-friendly implementation.
Conclusion
Integrating Data Vault 2.0 with dbt streamlines the data warehousing process by leveraging dbt’s capabilities to define models and macros, enabling efficient and dynamic SQL generation. This approach allows teams to focus on Data Vault design, with dbt handling the underlying logic.
Our open-source package DataVault4dbt brings these advantages to real-world projects, offering a reliable and standards-aligned way to build Hubs, Links, Satellites, and more.