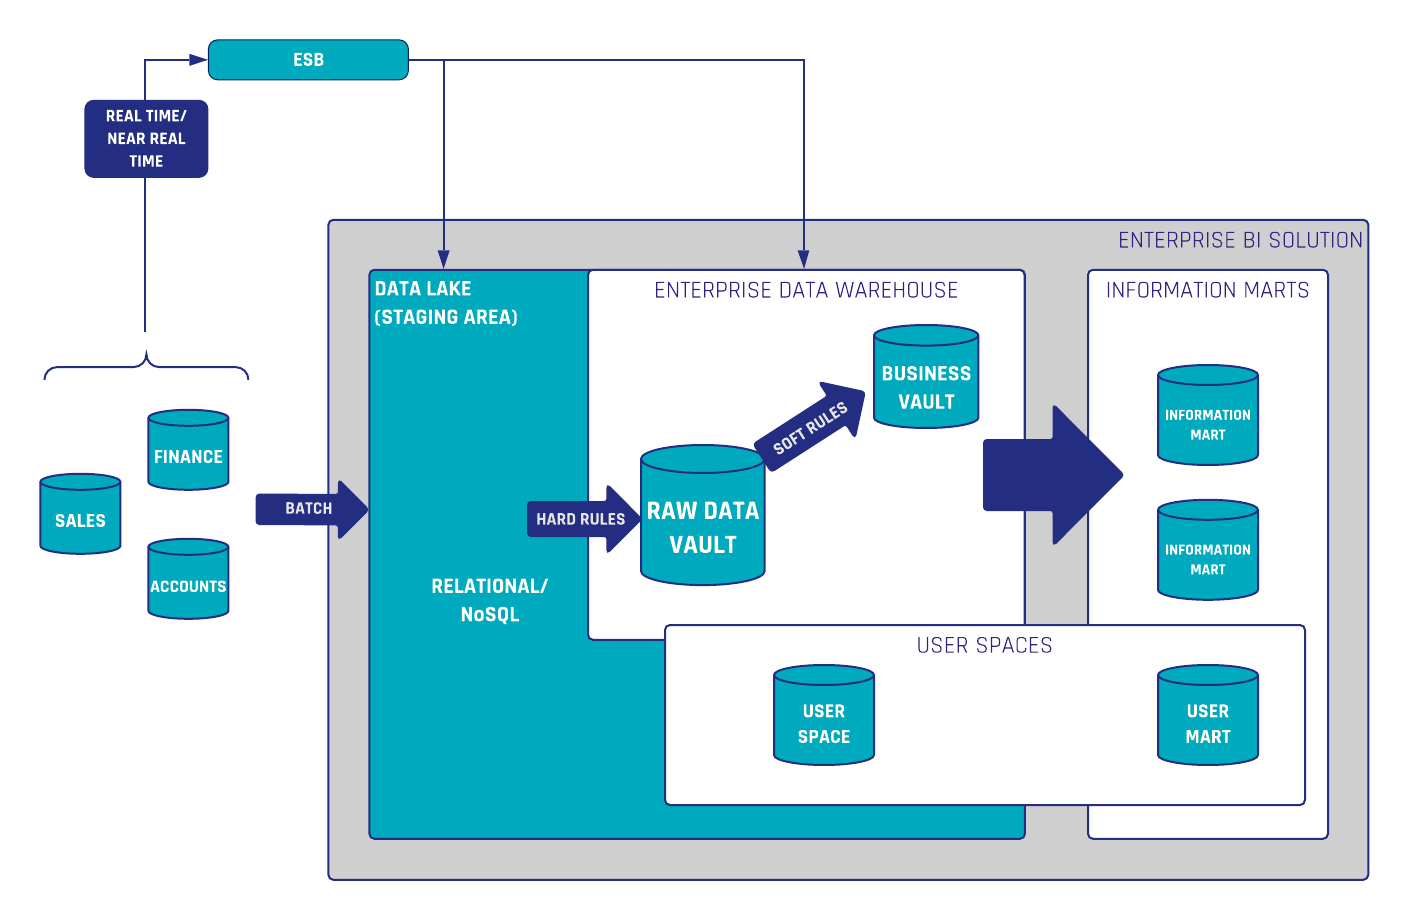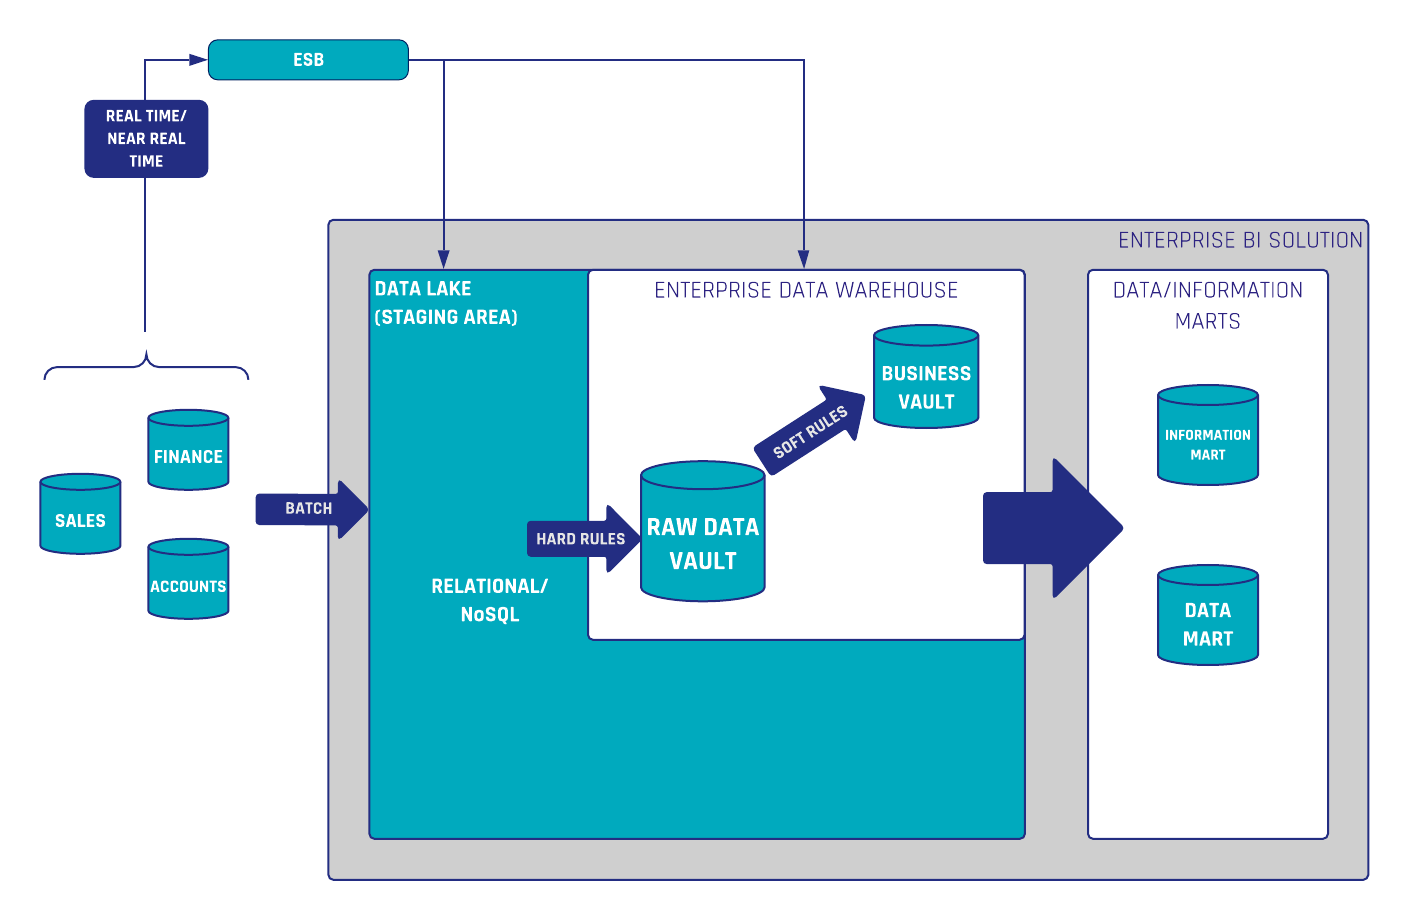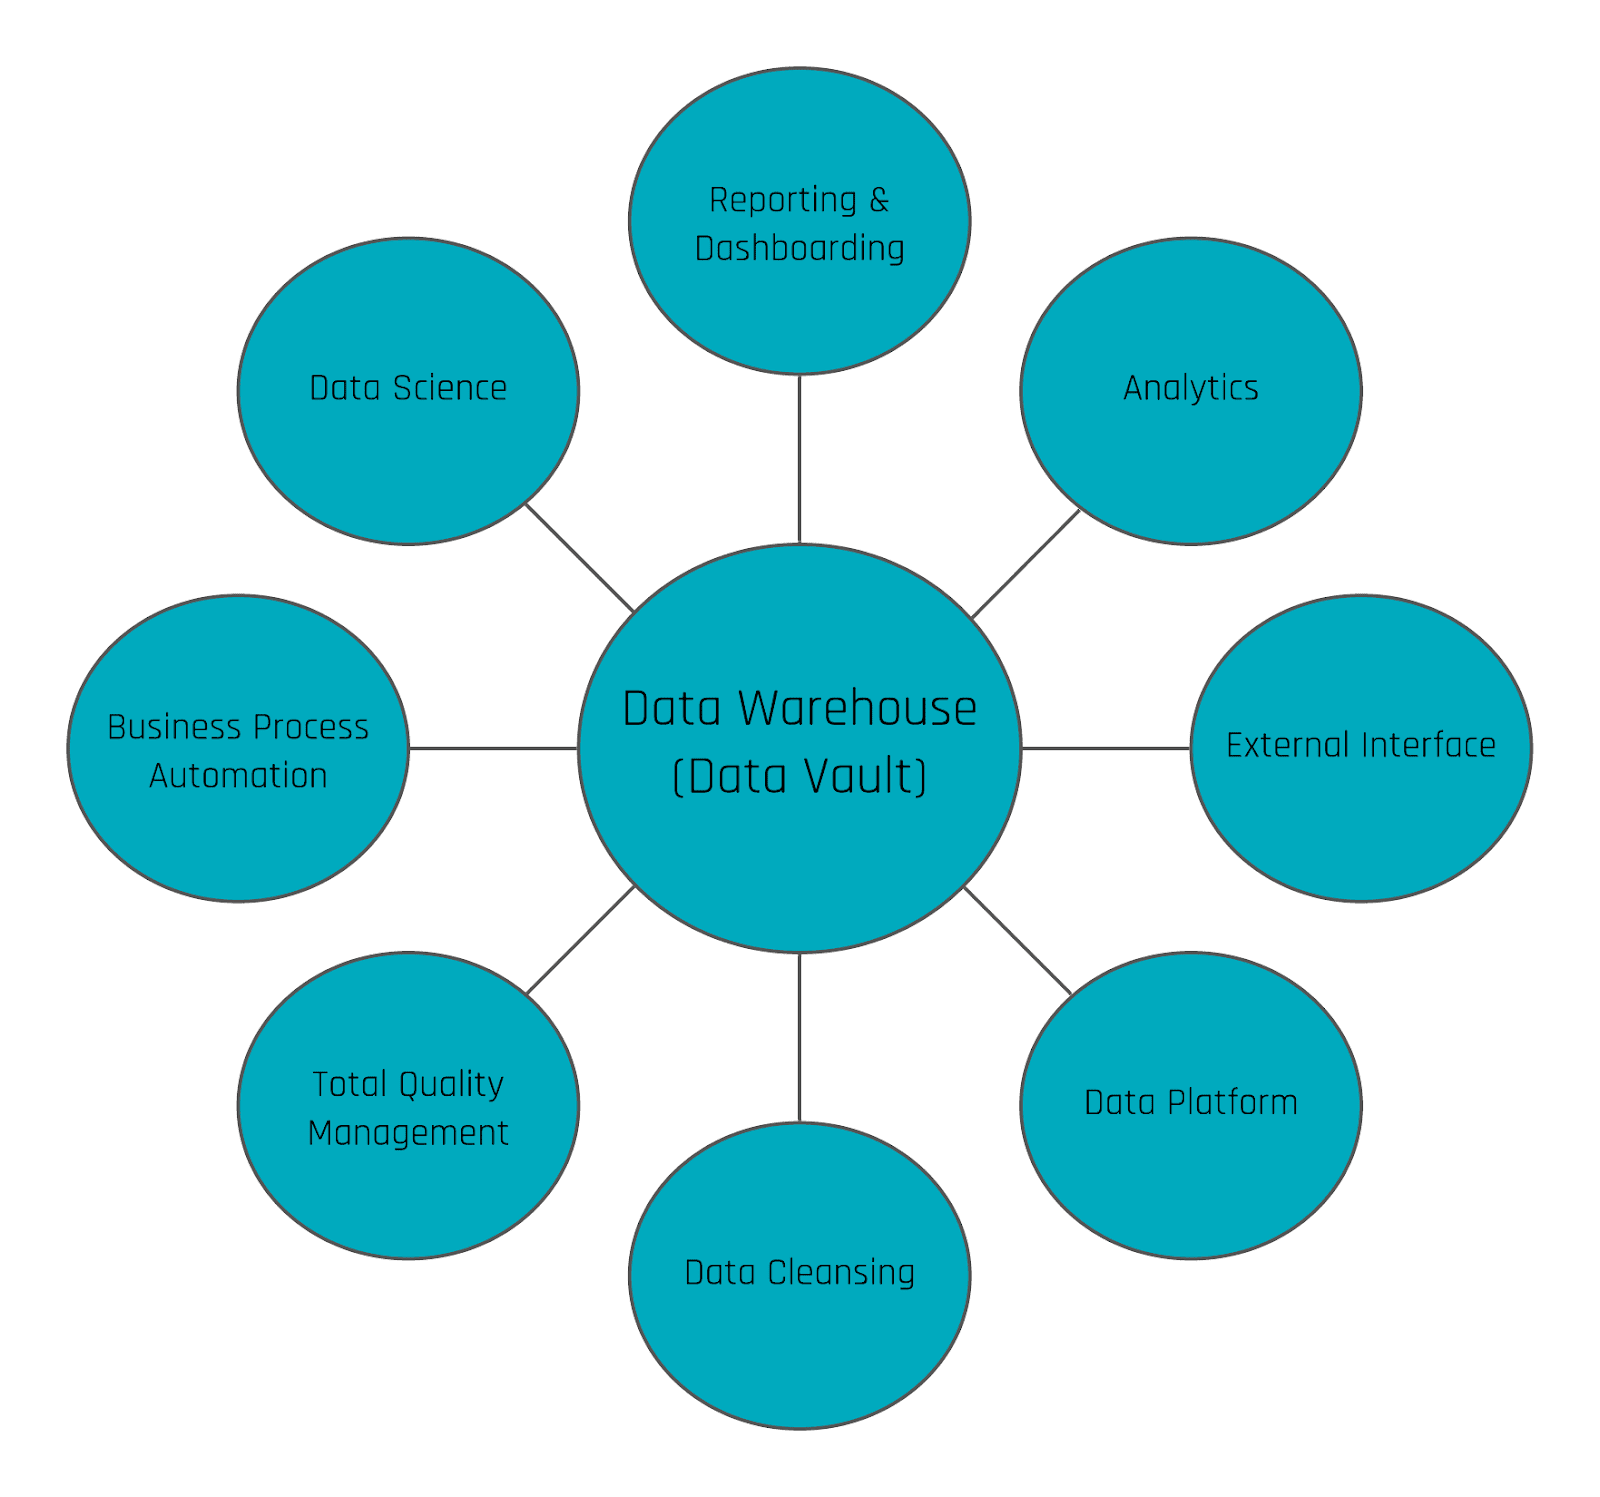
Information Marts in Data Vault 2.0
In the Data Vault 2.0 architecture, information marts are used to deliver information to the end-users. Conceptually, an information mart follows the same definition as a data mart in legacy data warehousing. However, in legacy data warehousing, a data mart is used to deliver useful information, not raw data. This is why the data mart has been renamed in Data Vault 2.0 to better reflect the use case.
Introduction to Information Marts
However, the definition of information marts has more facets. In the book “Building a Scalable Data Warehouse with Data Vault 2.0” we present three types of marts:
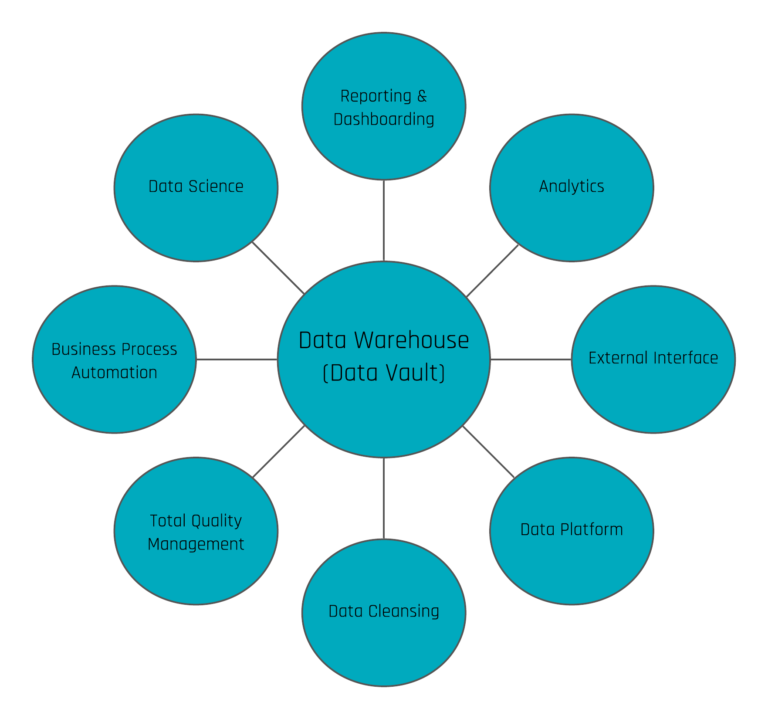
- Information marts: used to deliver information to business users, typically via dashboards and reports.
- Metrics Mart: used in conjunction with a Metrics Vault, which captures EDW log data in a Data Vault model. The Metrics Mart is derived from the Metrics Vault to present the metrics in order to analyze performance bottlenecks or resource consumption of power users and data scientists in managed self-service BI solutions.
- Error Mart: stores those records that typically fail a hard rule when loading the data into the enterprise data warehouse.
Information Marts for Consulting
In addition to these “classical” information marts, we use additional ones in our consulting practice:
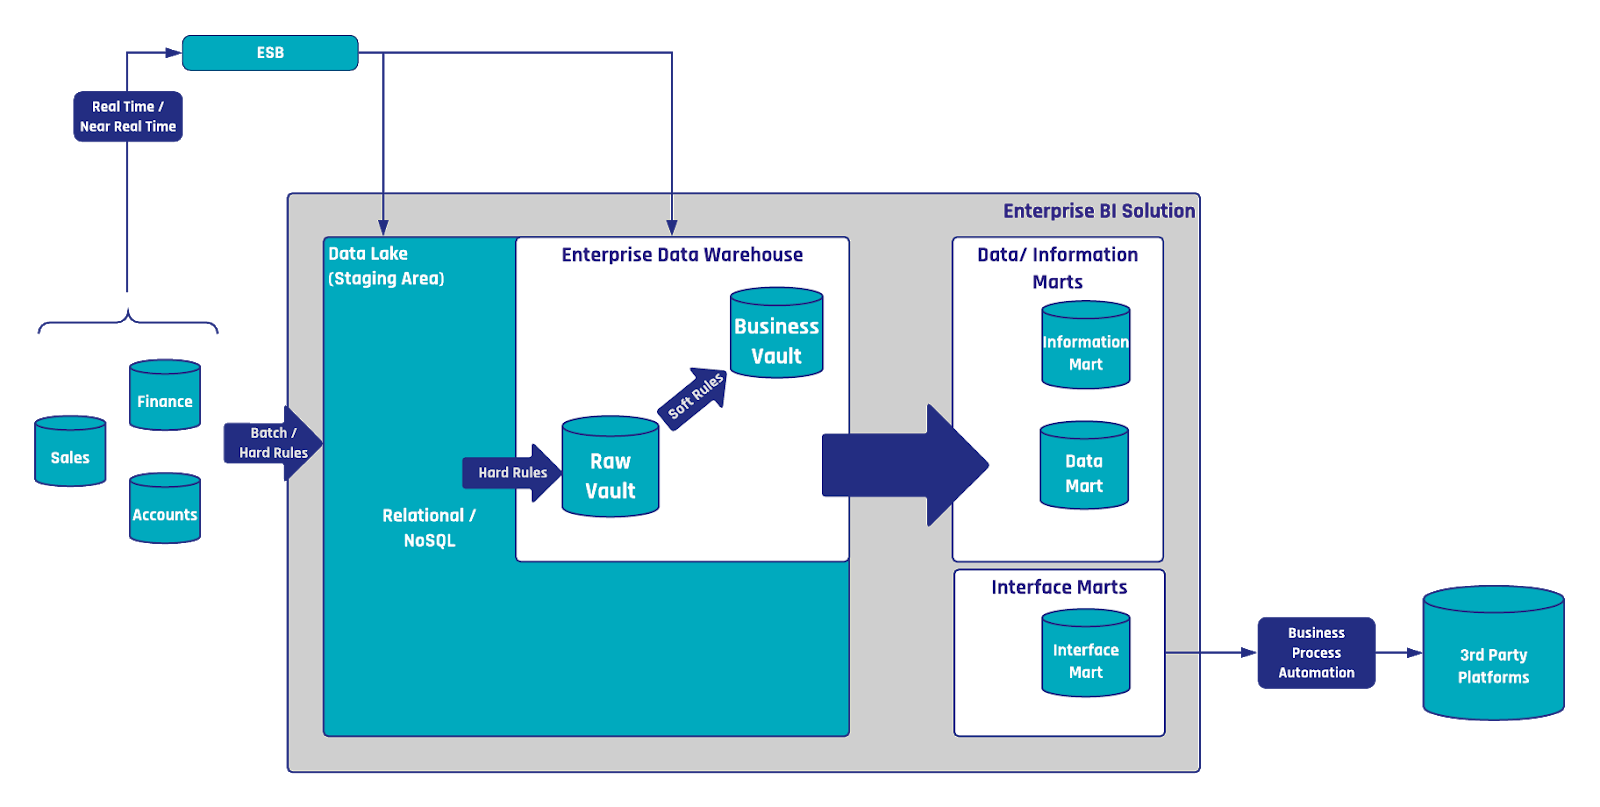
- Interface Mart: this is more or less an information mart, however, the information is not delivered to a human being, e.g. via a dashboard or report. Instead, it is delivered to a subsequent application or, as a write-back, to the source system (for example when using the enterprise data warehouse for data cleansing).
- Quality Mart: the quality mart is again an information mart, but instead of cleansing bad data, it is used to report bad data. Essentially, it turns the business logic used to cleanse bad data upside down: only bad data (well and ugly data sometimes) is delivered to the end-user, the data steward. This is often done in conjunction with data cleansing frontends where the data steward can either correct source data or comment and tag the exceptions.
- Source Mart: again an information mart, but this time not using one of the popular schemas, such as star schemas, snowflake schemas, or fully denormalized schemas. Instead, the information mart uses the data model of the source application, similar to an operational data store (ODS) schema. However, the Source Mart is not a copy of the data, it is a virtualized model on top of the Data Vault model, reflecting the original structures. It is great for ad-hoc reporting and of great value for many data scientists and power users.
This concludes our list of information marts. We have used them successfully in projects for our clients to better communicate the actual application of the information marts in their organization.
Conclusion
Information marts in Data Vault 2.0 are essential for delivering processed data to end-users through reports and dashboards. Variants like Metrics Marts and Error Marts enhance performance analysis and data quality management. Additionally, specialized marts such as Interface, Quality, and Source Marts cater to specific business needs, ensuring flexible and efficient data delivery.